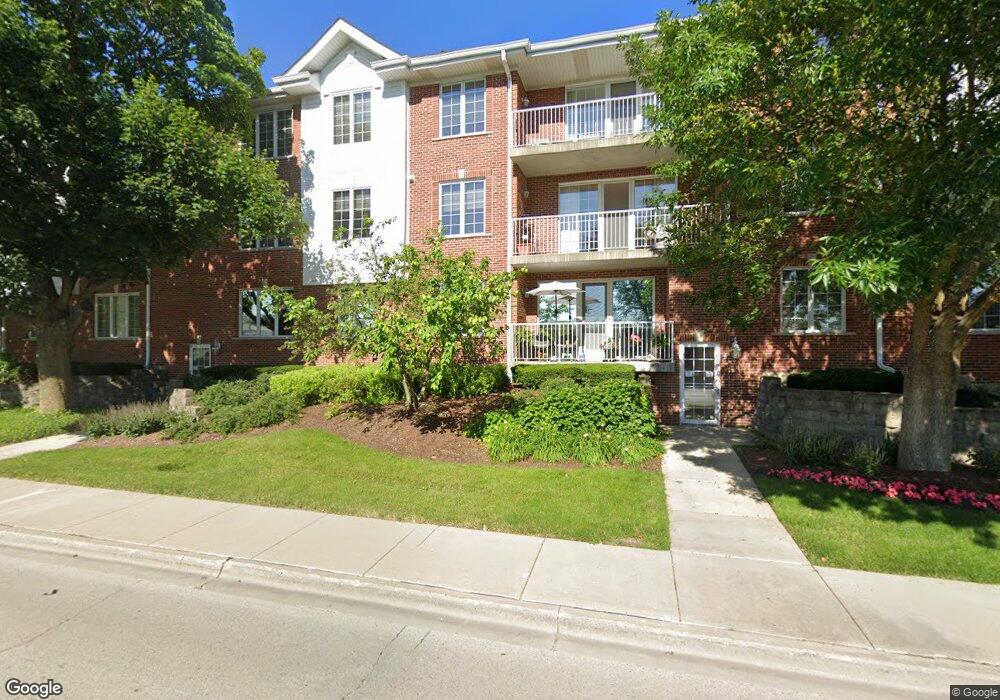
541 N Hough St Unit 5412D Barrington, IL 60010
North Barrington Hills NeighborhoodEstimated Value: $305,253 - $341,000
--
Bed
2
Baths
1,597
Sq Ft
$204/Sq Ft
Est. Value
About This Home
This home is located at 541 N Hough St Unit 5412D, Barrington, IL 60010 and is currently estimated at $325,063, approximately $203 per square foot. 541 N Hough St Unit 5412D is a home located in Lake County with nearby schools including Hough Street Elementary School, Barrington Middle School Station Campus, and Barrington High School.
Ownership History
Date
Name
Owned For
Owner Type
Purchase Details
Closed on
Mar 18, 2015
Sold by
Mccullough Shawn M
Bought by
Demoss Joann and Demoss Dennis
Current Estimated Value
Home Financials for this Owner
Home Financials are based on the most recent Mortgage that was taken out on this home.
Original Mortgage
$179,200
Outstanding Balance
$132,386
Interest Rate
2.75%
Mortgage Type
Adjustable Rate Mortgage/ARM
Estimated Equity
$192,677
Purchase Details
Closed on
Oct 19, 2009
Sold by
Mccullough Gerald L and Mccullough Kathryn E
Bought by
Magee Ronald
Purchase Details
Closed on
Dec 19, 2000
Sold by
Barrington Place Llc
Bought by
Mccullough Gerald L and Mccullough Kathryn E
Home Financials for this Owner
Home Financials are based on the most recent Mortgage that was taken out on this home.
Original Mortgage
$225,000
Interest Rate
8%
Create a Home Valuation Report for This Property
The Home Valuation Report is an in-depth analysis detailing your home's value as well as a comparison with similar homes in the area
Home Values in the Area
Average Home Value in this Area
Purchase History
| Date | Buyer | Sale Price | Title Company |
|---|---|---|---|
| Demoss Joann | $224,000 | Proper Title Llc | |
| Magee Ronald | $190,000 | None Available | |
| Mccullough Gerald L | $189,000 | 1St American Title |
Source: Public Records
Mortgage History
| Date | Status | Borrower | Loan Amount |
|---|---|---|---|
| Open | Demoss Joann | $179,200 | |
| Previous Owner | Mccullough Gerald L | $225,000 |
Source: Public Records
Tax History Compared to Growth
Tax History
| Year | Tax Paid | Tax Assessment Tax Assessment Total Assessment is a certain percentage of the fair market value that is determined by local assessors to be the total taxable value of land and additions on the property. | Land | Improvement |
|---|---|---|---|---|
| 2024 | $5,000 | $83,724 | $3,034 | $80,690 |
| 2023 | $5,876 | $83,098 | $3,012 | $80,086 |
| 2022 | $5,876 | $82,869 | $563 | $82,306 |
| 2021 | $5,797 | $81,459 | $553 | $80,906 |
| 2020 | $5,648 | $81,207 | $551 | $80,656 |
| 2019 | $5,421 | $79,064 | $536 | $78,528 |
| 2018 | $5,047 | $75,550 | $568 | $74,982 |
| 2017 | $5,014 | $74,033 | $557 | $73,476 |
| 2016 | $4,932 | $71,240 | $536 | $70,704 |
| 2015 | $5,104 | $66,817 | $503 | $66,314 |
| 2014 | $5,075 | $63,356 | $480 | $62,876 |
| 2012 | $5,219 | $64,445 | $488 | $63,957 |
Source: Public Records
Map
Nearby Homes
- 541 N Hough St Unit 205
- 520 Shorely Dr Unit 201
- 565 Shorely Dr Unit 202
- 709 Prospect Ave
- 206 N Cook St
- 0 Illinois Route 59
- 136 Grant St
- 148 W Station St
- 215 N Hager Ave
- 323 W Main St
- 126 W Lake St
- 534 E Main St
- 26225 W Merton Rd
- 440 W Main St
- 319 W Lake St
- 432 Whitney Dr
- 26303 W Merton Rd
- 145 Walton St
- 345 E Russell St
- 221 Coolidge Ave
- 541 N Hough St Unit 304
- 541 N Hough St Unit 5413F
- 541 N Hough St Unit 5413E
- 541 N Hough St Unit 5413D
- 541 N Hough St Unit 5413C
- 541 N Hough St Unit 5413B
- 541 N Hough St Unit 306
- 541 N Hough St Unit 5412F
- 541 N Hough St Unit 203
- 541 N Hough St Unit 5412C
- 541 N Hough St Unit 5412B
- 541 N Hough St Unit 5411F
- 541 N Hough St Unit 5411E
- 541 N Hough St Unit 5411D
- 541 N Hough St Unit 5411C
- 541 N Hough St Unit 104
- 541 N Hough St Unit 5411A
- 541 N Hough St Unit 206
- 541 N Hough St Unit 201
- 541 N Hough St Unit 202