541 Osprey Way Fernley, NV 89408
Estimated Value: $401,000 - $435,000
3
Beds
2
Baths
1,743
Sq Ft
$237/Sq Ft
Est. Value
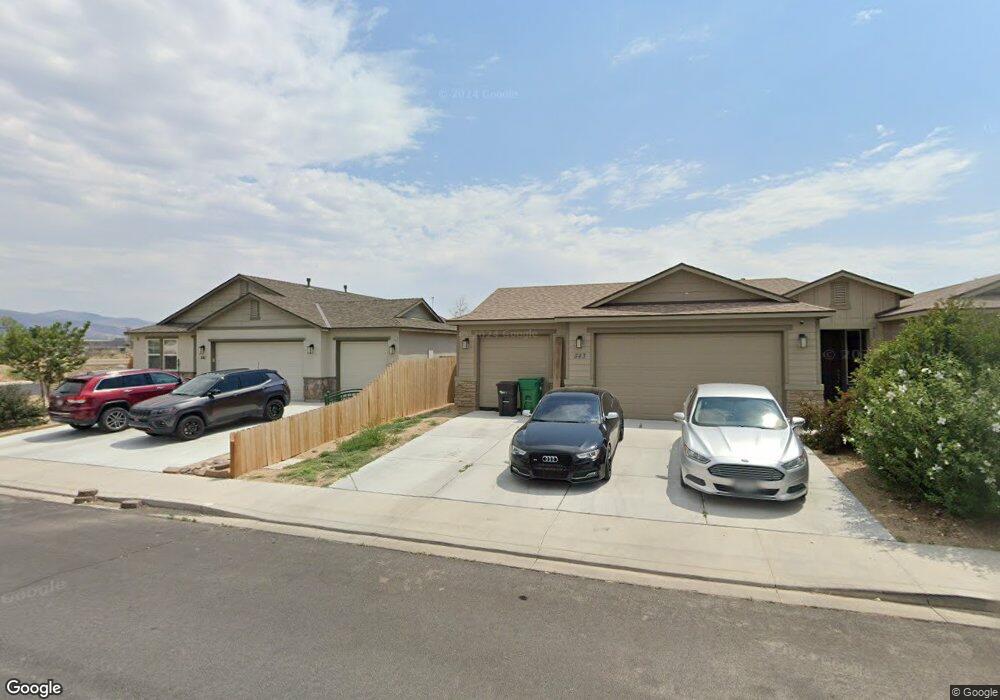
About This Home
This home is located at 541 Osprey Way, Fernley, NV 89408 and is currently estimated at $413,244, approximately $237 per square foot. 541 Osprey Way is a home with nearby schools including Fernley Elementary School, Fernley Intermediate School, and Fernley High School.
Ownership History
Date
Name
Owned For
Owner Type
Purchase Details
Closed on
Jan 23, 2020
Sold by
The Meadows Ii Llc
Bought by
Dunn Rebecca and Dunn Sandra
Current Estimated Value
Home Financials for this Owner
Home Financials are based on the most recent Mortgage that was taken out on this home.
Original Mortgage
$290,700
Outstanding Balance
$256,845
Interest Rate
3.6%
Mortgage Type
New Conventional
Estimated Equity
$156,399
Purchase Details
Closed on
Apr 15, 2010
Sold by
Svww Ii Llc
Bought by
Belanger Brian L and Belanger Mariann F
Create a Home Valuation Report for This Property
The Home Valuation Report is an in-depth analysis detailing your home's value as well as a comparison with similar homes in the area
Home Values in the Area
Average Home Value in this Area
Purchase History
| Date | Buyer | Sale Price | Title Company |
|---|---|---|---|
| Dunn Rebecca | $309,850 | First American Title Sparks | |
| Belanger Brian L | $100,000 | Western Nevada Title Company |
Source: Public Records
Mortgage History
| Date | Status | Borrower | Loan Amount |
|---|---|---|---|
| Open | Dunn Rebecca | $290,700 |
Source: Public Records
Tax History Compared to Growth
Tax History
| Year | Tax Paid | Tax Assessment Tax Assessment Total Assessment is a certain percentage of the fair market value that is determined by local assessors to be the total taxable value of land and additions on the property. | Land | Improvement |
|---|---|---|---|---|
| 2025 | $3,721 | $123,910 | $36,750 | $87,161 |
| 2024 | $4,021 | $124,001 | $36,750 | $87,250 |
| 2023 | $4,021 | $118,109 | $36,750 | $81,359 |
| 2022 | $3,784 | $111,791 | $36,750 | $75,041 |
| 2021 | $3,710 | $106,163 | $33,250 | $72,913 |
| 2020 | $3,610 | $102,373 | $33,250 | $69,123 |
| 2019 | $445 | $19,600 | $19,600 | $0 |
| 2018 | $439 | $10,150 | $10,150 | $0 |
| 2017 | $451 | $7,350 | $7,350 | $0 |
| 2016 | $353 | $4,040 | $4,040 | $0 |
| 2015 | $375 | $4,040 | $4,040 | $0 |
| 2014 | $373 | $4,040 | $4,040 | $0 |
Source: Public Records
Map
Nearby Homes