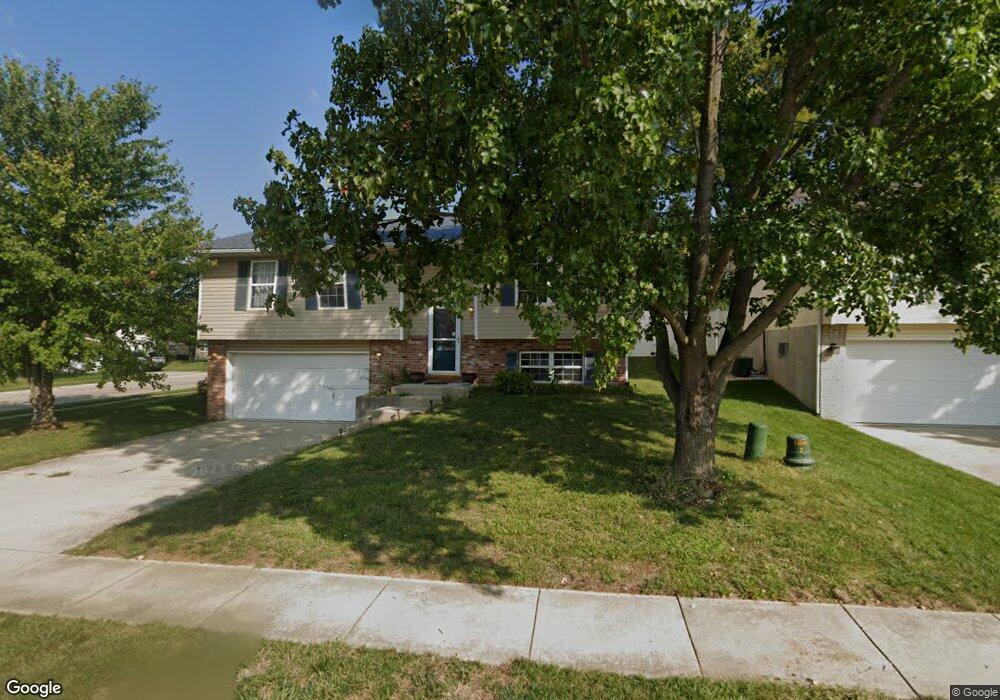
541 Pennsylvania St Collinsville, IL 62234
Estimated Value: $219,000 - $267,000
3
Beds
2
Baths
1,025
Sq Ft
$235/Sq Ft
Est. Value
About This Home
This home is located at 541 Pennsylvania St, Collinsville, IL 62234 and is currently estimated at $240,835, approximately $234 per square foot. 541 Pennsylvania St is a home located in Madison County with nearby schools including John A Renfro Elementary School, Dorris Intermediate School, and Collinsville Middle School.
Ownership History
Date
Name
Owned For
Owner Type
Purchase Details
Closed on
Nov 10, 2021
Sold by
Hine James
Bought by
Hine Kimberly
Current Estimated Value
Purchase Details
Closed on
Aug 11, 2009
Sold by
Chandler Raymond E and Chandler Katherine M
Bought by
Hine James and Hine Kimberly
Purchase Details
Closed on
Jul 2, 2007
Sold by
Inoue Asao and Inoue Kelly R
Bought by
Chandler Raymonde E and Chandler Katherine M
Home Financials for this Owner
Home Financials are based on the most recent Mortgage that was taken out on this home.
Original Mortgage
$28,800
Interest Rate
6.42%
Mortgage Type
Unknown
Purchase Details
Closed on
Jun 7, 2005
Sold by
Osborn Homes Inc
Bought by
Inoue Asao and Inoue Kelly R
Home Financials for this Owner
Home Financials are based on the most recent Mortgage that was taken out on this home.
Original Mortgage
$114,700
Interest Rate
5.87%
Mortgage Type
Fannie Mae Freddie Mac
Create a Home Valuation Report for This Property
The Home Valuation Report is an in-depth analysis detailing your home's value as well as a comparison with similar homes in the area
Home Values in the Area
Average Home Value in this Area
Purchase History
| Date | Buyer | Sale Price | Title Company |
|---|---|---|---|
| Hine Kimberly | -- | Abstracts & Titles | |
| Hine James | $147,000 | Abstracts & Titles Inc | |
| Chandler Raymonde E | $146,000 | Abstracts & Titles Inc | |
| Inoue Asao | $143,500 | Abstracts & Titles Inc |
Source: Public Records
Mortgage History
| Date | Status | Borrower | Loan Amount |
|---|---|---|---|
| Previous Owner | Chandler Raymonde E | $28,800 | |
| Previous Owner | Chandler Raymonde E | $115,200 | |
| Previous Owner | Inoue Asao | $114,700 | |
| Closed | Inoue Asao | $28,700 |
Source: Public Records
Tax History Compared to Growth
Tax History
| Year | Tax Paid | Tax Assessment Tax Assessment Total Assessment is a certain percentage of the fair market value that is determined by local assessors to be the total taxable value of land and additions on the property. | Land | Improvement |
|---|---|---|---|---|
| 2024 | $3,677 | $63,510 | $14,650 | $48,860 |
| 2023 | $3,677 | $57,870 | $13,330 | $44,540 |
| 2022 | $3,414 | $53,520 | $12,330 | $41,190 |
| 2021 | $3,059 | $50,280 | $11,580 | $38,700 |
| 2020 | $2,930 | $47,970 | $11,050 | $36,920 |
| 2019 | $2,707 | $44,480 | $11,790 | $32,690 |
| 2018 | $2,633 | $42,140 | $11,170 | $30,970 |
| 2017 | $2,628 | $41,300 | $10,950 | $30,350 |
| 2016 | $2,759 | $41,300 | $10,950 | $30,350 |
| 2015 | $3,297 | $40,230 | $10,670 | $29,560 |
| 2014 | $3,297 | $40,230 | $10,670 | $29,560 |
| 2013 | $3,297 | $40,230 | $10,670 | $29,560 |
Source: Public Records
Map
Nearby Homes
- 501 Spring
- 1210 Constance St
- 1227 Ridge Ave
- 1120 Williams St
- 919 Vine St
- 706 Illinois Ave
- 921 Prospect St
- 308 Brown Ave
- 892 Lester Ave
- 617 N Morrison Ave
- 203 Greenfield Dr
- 1002 California Ave
- 238 Mill St
- 1224 Cedar Ridge Ct
- 123 W Wickliffe Ave
- 404 E Church St
- 0 N Keebler Ave
- 216 S Chestnut St
- 1322 Leland St
- 102 Toni Ct
- 543 Pennsylvania St
- 645 High School St
- 641 High School St
- 1005 Vermont Ave
- 640 High School St
- 636 High School St
- 540 Pennsylvania St
- 545 Pennsylvania St
- 648 High School St
- 632 High School St
- 542 Pennsylvania St
- 644 High School St
- 1009 Vermont Ave
- 546 Pennsylvania St
- 637 High School St
- 628 High School St
- 1013 Vermont Ave
- 652 High School St
- 624 High School St
- 633 High School St