Estimated Value: $576,000 - $641,033
3
Beds
2
Baths
2,956
Sq Ft
$203/Sq Ft
Est. Value
About This Home
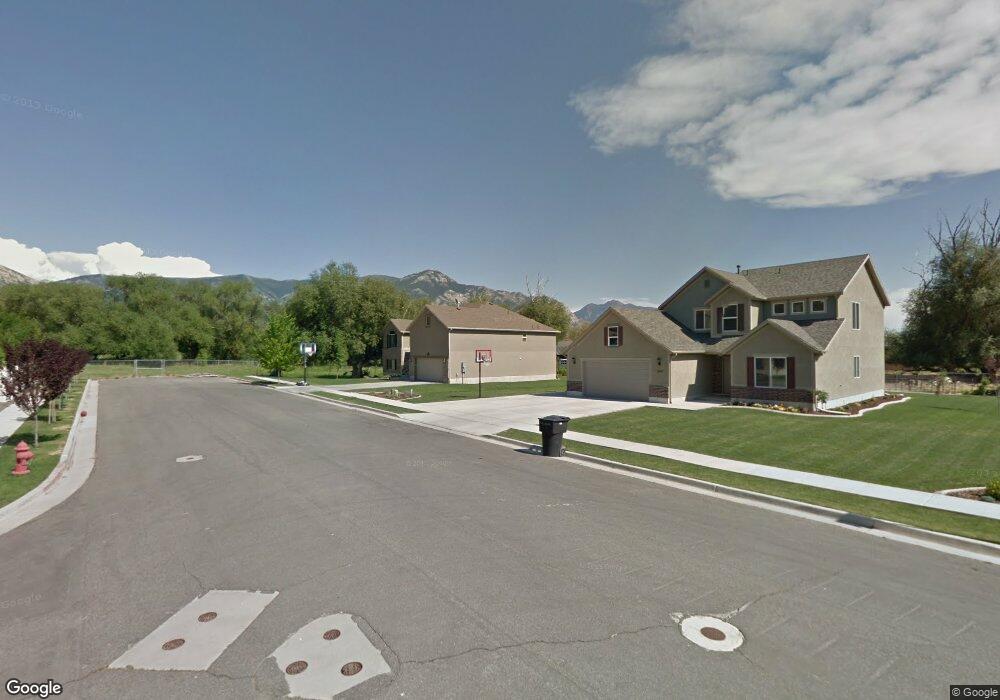
This home is located at 541 W 3000 N, Ogden, UT 84414 and is currently estimated at $601,008, approximately $203 per square foot. 541 W 3000 N is a home located in Weber County with nearby schools including Lomond View School, Orion Junior High School, and Weber High School.
Ownership History
Date
Name
Owned For
Owner Type
Purchase Details
Closed on
May 14, 2012
Sold by
Bolingbrooke Jeff and Bolingbrooke Emilee
Bought by
Bolingbrooke Jeffrey L and Bolingbrooke Emilee
Current Estimated Value
Home Financials for this Owner
Home Financials are based on the most recent Mortgage that was taken out on this home.
Original Mortgage
$201,000
Outstanding Balance
$118,417
Interest Rate
3.98%
Mortgage Type
New Conventional
Estimated Equity
$482,591
Purchase Details
Closed on
Mar 21, 2008
Sold by
Destination Homes Inc
Bought by
Bolingbroke Jeff and Bolingbroke Emilee
Home Financials for this Owner
Home Financials are based on the most recent Mortgage that was taken out on this home.
Original Mortgage
$207,800
Interest Rate
5.72%
Mortgage Type
Purchase Money Mortgage
Purchase Details
Closed on
Feb 27, 2006
Sold by
Zion Development Llc
Bought by
Destination Homes Inc
Create a Home Valuation Report for This Property
The Home Valuation Report is an in-depth analysis detailing your home's value as well as a comparison with similar homes in the area
Home Values in the Area
Average Home Value in this Area
Purchase History
| Date | Buyer | Sale Price | Title Company |
|---|---|---|---|
| Bolingbrooke Jeffrey L | -- | Meridian Title Company | |
| Bolingbroke Jeff | -- | Bonneville Superior Title Co | |
| Destination Homes Inc | -- | Mountain View Title Ogden |
Source: Public Records
Mortgage History
| Date | Status | Borrower | Loan Amount |
|---|---|---|---|
| Open | Bolingbrooke Jeffrey L | $201,000 | |
| Closed | Bolingbroke Jeff | $207,800 |
Source: Public Records
Tax History
| Year | Tax Paid | Tax Assessment Tax Assessment Total Assessment is a certain percentage of the fair market value that is determined by local assessors to be the total taxable value of land and additions on the property. | Land | Improvement |
|---|---|---|---|---|
| 2025 | $3,974 | $629,749 | $230,041 | $399,708 |
| 2024 | $3,904 | $340,999 | $126,522 | $214,477 |
| 2023 | $4,013 | $354,200 | $126,499 | $227,701 |
| 2022 | $3,748 | $337,700 | $99,000 | $238,700 |
| 2021 | $3,331 | $507,000 | $115,000 | $392,000 |
| 2020 | $3,062 | $429,000 | $95,009 | $333,991 |
| 2019 | $2,952 | $394,000 | $85,017 | $308,983 |
| 2018 | $3,048 | $392,000 | $80,015 | $311,985 |
| 2017 | $2,864 | $347,000 | $80,015 | $266,985 |
| 2016 | $2,546 | $166,969 | $43,954 | $123,015 |
| 2015 | $2,559 | $167,224 | $43,954 | $123,270 |
| 2014 | $2,213 | $140,196 | $38,542 | $101,654 |
Source: Public Records
Map
Nearby Homes
- 38 White Barn Dr
- 42 White Barn Dr
- 69 White Barn Dr
- 307 Willow Way
- 304 W Willow Way
- 3252 N 600 W
- 113 Hillsborough Dr
- 43 Hillsborough Dr
- 3171 N 275 W
- 747 W 2775 N
- 615 Fox Meadow Dr
- 759 W Fox Meadow Dr
- 238 W 3175 N
- 3303 N 300 W
- 2717 N 825 W Unit 28
- 641 W Elberta Dr Unit 1
- 255 W 2700 N Unit 12
- 3012 N 175 W
- 2517 N Dorchester Ave
- 3478 N 400 W
Your Personal Tour Guide
Ask me questions while you tour the home.