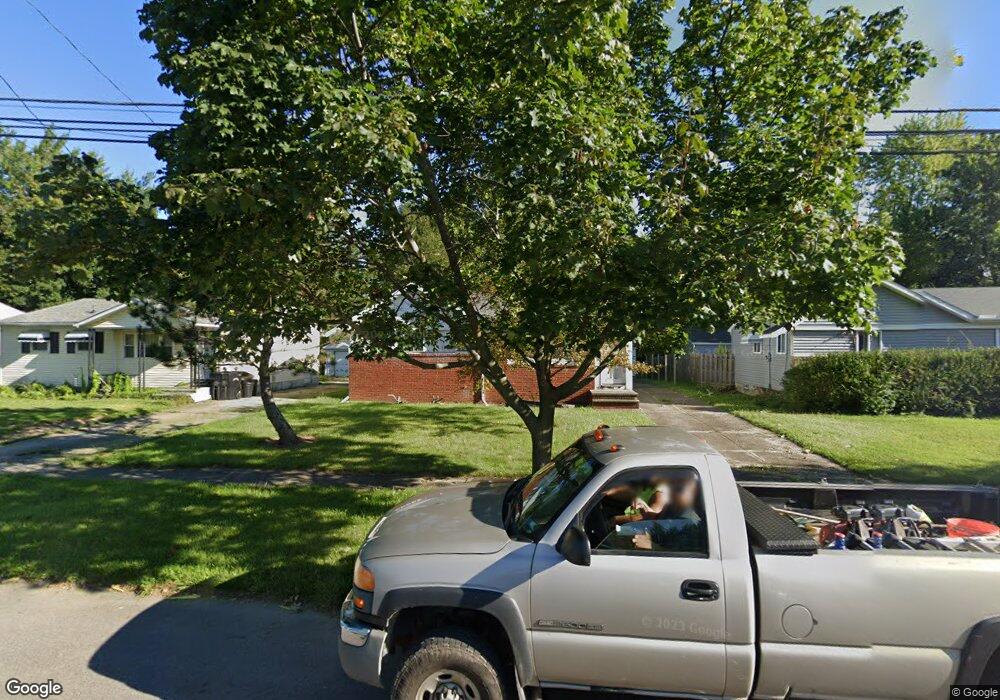
541 Walnut St Elyria, OH 44035
Estimated Value: $106,000 - $123,000
3
Beds
1
Bath
884
Sq Ft
$129/Sq Ft
Est. Value
About This Home
This home is located at 541 Walnut St, Elyria, OH 44035 and is currently estimated at $114,437, approximately $129 per square foot. 541 Walnut St is a home located in Lorain County with nearby schools including Westwood Middle School, Elyria High School, and St Mary Elementary School.
Ownership History
Date
Name
Owned For
Owner Type
Purchase Details
Closed on
Mar 10, 2005
Sold by
Wells Fargo Bank Minnesota Na
Bought by
Radabaugh Kenneth R
Current Estimated Value
Home Financials for this Owner
Home Financials are based on the most recent Mortgage that was taken out on this home.
Original Mortgage
$48,800
Outstanding Balance
$24,740
Interest Rate
5.61%
Mortgage Type
Purchase Money Mortgage
Estimated Equity
$89,697
Purchase Details
Closed on
Oct 25, 2004
Sold by
Robertson Ian and Robertson Ian S
Bought by
Wells Fargo Bank Minnesota Na and Structured Asset Securities Corp Amortiz
Purchase Details
Closed on
Aug 8, 2002
Sold by
Marie Jones Helen and Jones Marie
Bought by
Robertson Ian
Home Financials for this Owner
Home Financials are based on the most recent Mortgage that was taken out on this home.
Original Mortgage
$63,000
Interest Rate
10.3%
Mortgage Type
Assumption
Create a Home Valuation Report for This Property
The Home Valuation Report is an in-depth analysis detailing your home's value as well as a comparison with similar homes in the area
Home Values in the Area
Average Home Value in this Area
Purchase History
| Date | Buyer | Sale Price | Title Company |
|---|---|---|---|
| Radabaugh Kenneth R | $61,000 | Resource Title Agency Inc | |
| Wells Fargo Bank Minnesota Na | $42,000 | Resource Title Agency Inc | |
| Robertson Ian | $70,000 | Real Estate Title |
Source: Public Records
Mortgage History
| Date | Status | Borrower | Loan Amount |
|---|---|---|---|
| Open | Radabaugh Kenneth R | $48,800 | |
| Previous Owner | Robertson Ian | $63,000 | |
| Closed | Robertson Ian | $5,500 |
Source: Public Records
Tax History
| Year | Tax Paid | Tax Assessment Tax Assessment Total Assessment is a certain percentage of the fair market value that is determined by local assessors to be the total taxable value of land and additions on the property. | Land | Improvement |
|---|---|---|---|---|
| 2024 | $1,632 | $33,660 | $6,682 | $26,978 |
| 2023 | $1,245 | $22,299 | $6,171 | $16,128 |
| 2022 | $1,241 | $22,299 | $6,171 | $16,128 |
| 2021 | $1,244 | $22,299 | $6,171 | $16,128 |
| 2020 | $1,167 | $18,610 | $5,150 | $13,460 |
| 2019 | $1,160 | $18,610 | $5,150 | $13,460 |
| 2018 | $1,162 | $18,610 | $5,150 | $13,460 |
| 2017 | $973 | $14,940 | $3,630 | $11,310 |
| 2016 | $961 | $14,940 | $3,630 | $11,310 |
| 2015 | $901 | $14,940 | $3,630 | $11,310 |
| 2014 | $937 | $15,720 | $3,820 | $11,900 |
| 2013 | $929 | $15,720 | $3,820 | $11,900 |
Source: Public Records
Map
Nearby Homes
Your Personal Tour Guide
Ask me questions while you tour the home.