Estimated Value: $315,857 - $340,000
--
Bed
3
Baths
2,219
Sq Ft
$147/Sq Ft
Est. Value
About This Home
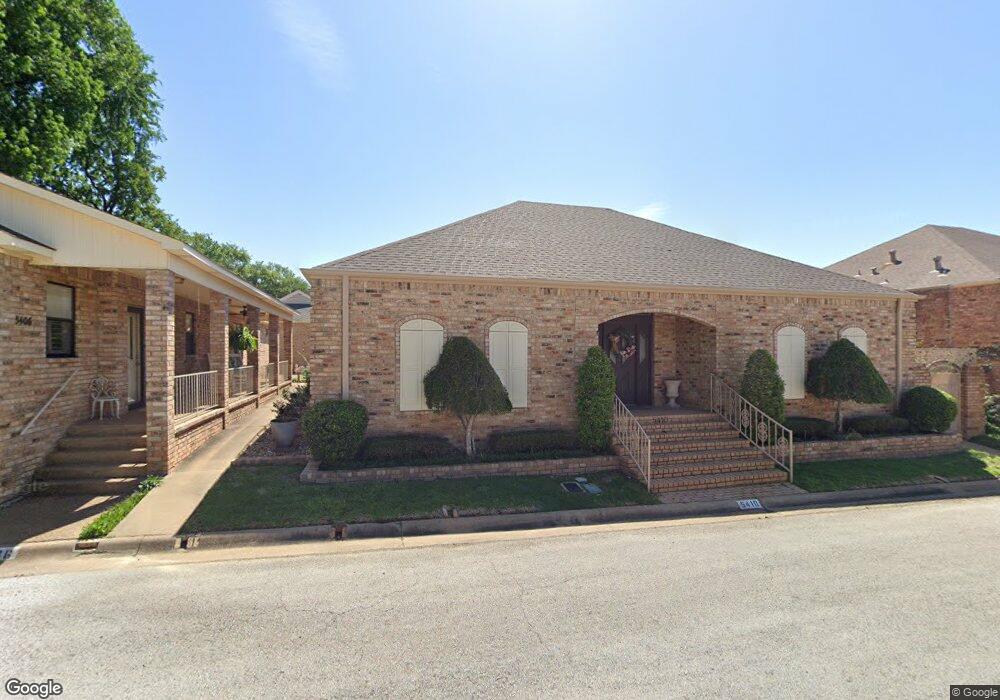
This home is located at 5410 Brandon Ct, Tyler, TX 75703 and is currently estimated at $325,964, approximately $146 per square foot. 5410 Brandon Ct is a home located in Smith County with nearby schools including Rice Elementary School, Hubbard Middle School, and Tyler Legacy High School.
Ownership History
Date
Name
Owned For
Owner Type
Purchase Details
Closed on
Oct 26, 2009
Sold by
Mccarter William E and Mccarter Billie S
Bought by
Jones E Deane
Current Estimated Value
Create a Home Valuation Report for This Property
The Home Valuation Report is an in-depth analysis detailing your home's value as well as a comparison with similar homes in the area
Home Values in the Area
Average Home Value in this Area
Purchase History
| Date | Buyer | Sale Price | Title Company |
|---|---|---|---|
| Jones E Deane | -- | -- |
Source: Public Records
Tax History Compared to Growth
Tax History
| Year | Tax Paid | Tax Assessment Tax Assessment Total Assessment is a certain percentage of the fair market value that is determined by local assessors to be the total taxable value of land and additions on the property. | Land | Improvement |
|---|---|---|---|---|
| 2025 | $1,442 | $327,330 | $20,612 | $306,718 |
| 2024 | $1,442 | $301,513 | $25,853 | $315,605 |
| 2023 | $4,778 | $274,103 | $25,853 | $248,250 |
| 2022 | $4,971 | $253,756 | $25,853 | $227,903 |
| 2021 | $4,945 | $235,716 | $25,853 | $209,863 |
| 2020 | $5,044 | $235,716 | $25,853 | $209,863 |
| 2019 | $5,014 | $231,975 | $24,895 | $207,080 |
| 2018 | $4,534 | $208,466 | $19,150 | $189,316 |
| 2017 | $4,465 | $209,136 | $19,150 | $189,986 |
| 2016 | $4,261 | $199,570 | $19,150 | $180,420 |
| 2015 | $3,042 | $193,396 | $19,150 | $174,246 |
| 2014 | $3,042 | $183,682 | $19,150 | $164,532 |
Source: Public Records
Map
Nearby Homes
- 5406 Carmel Ct
- 14237 County Road 192
- 14195 County Road 192
- 14245 County Road 192
- 6109 Quail Creek Dr
- 608 Top Hill Dr
- 601 Carriage Dr
- 7434 Waterview Square
- 6052 N Park Central Ct
- 6102 Wilderness Rd
- 5783 New Copeland Rd
- 5789 New Copeland Rd
- 5802 Briar Creek Dr
- 709 W Rieck Rd
- 709 Top Hill Dr
- 5219 Stagecoach St
- 717 Meadow Creek Dr
- 5117 Stagecoach St
- 5117 Stagecoach Dr
- 842 Ashford Ct
- 5406 5406 Brandon Ct
- 5406 Brandon Ct
- 5414 Brandon Ct
- 5401 Carmel Ct
- 5402 Brandon Ct
- 5409 Carmel Ct
- 5418 Brandon Ct
- 5415 Brandon Ct
- 5415 5415 Brandon Ct
- 201 Atlanta Ave
- 5413 Carmel Ct
- 5413 5413 Carmel Ct
- 5400 Carmel Ct
- 5400 5400 Carmel Ct
- 207 Atlanta Ave
- 131 Atlanta Ave
- 5420 Brandon Ct
- 207 207 Atlanta Ave
- 5417 Carmel Ct
- 5409 Brandon Ct