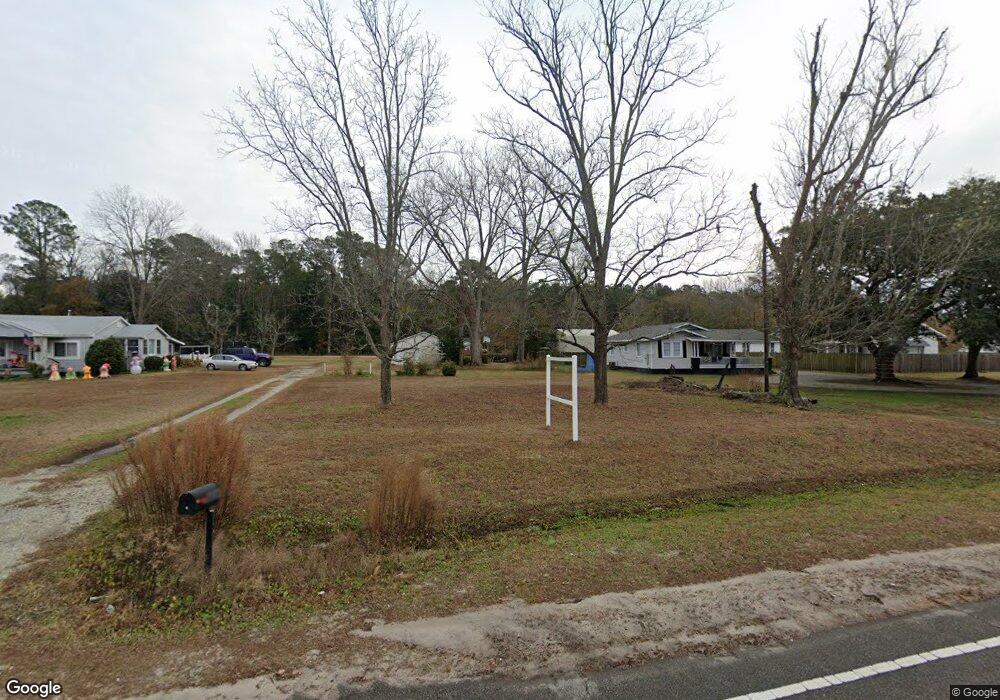
5410 Castle Hayne Rd Castle Hayne, NC 28429
Estimated Value: $144,885 - $267,000
2
Beds
1
Bath
832
Sq Ft
$260/Sq Ft
Est. Value
About This Home
This home is located at 5410 Castle Hayne Rd, Castle Hayne, NC 28429 and is currently estimated at $216,295, approximately $259 per square foot. 5410 Castle Hayne Rd is a home located in New Hanover County with nearby schools including Castle Hayne Elementary School, Holly Shelter Middle School, and Emsley A. Laney High School.
Ownership History
Date
Name
Owned For
Owner Type
Purchase Details
Closed on
Jan 18, 2005
Sold by
D Reeves Properties Llc
Bought by
Smith Jayne Underwood
Current Estimated Value
Purchase Details
Closed on
Nov 30, 2004
Sold by
Miller Donald Gene
Bought by
D Reeves Properties Llc
Purchase Details
Closed on
Jun 30, 2004
Sold by
Miller Donald Gene
Bought by
D Reeves Properties Llc
Purchase Details
Closed on
May 8, 1998
Sold by
Bryd Heather R John W
Bought by
Miller Donald Gene
Purchase Details
Closed on
May 26, 1995
Sold by
Tucker Roger Dale Mary S
Bought by
Bryd Heather R John W
Purchase Details
Closed on
Dec 4, 1989
Sold by
Callahan John C Alonza P
Bought by
Tucker Roger Dale Mary S
Purchase Details
Closed on
Aug 1, 1987
Sold by
Davis Virginia R
Bought by
Callahan John C Alonza P
Purchase Details
Closed on
Dec 1, 1956
Bought by
Davis Virginia R
Create a Home Valuation Report for This Property
The Home Valuation Report is an in-depth analysis detailing your home's value as well as a comparison with similar homes in the area
Home Values in the Area
Average Home Value in this Area
Purchase History
| Date | Buyer | Sale Price | Title Company |
|---|---|---|---|
| Smith Jayne Underwood | $110,000 | None Available | |
| D Reeves Properties Llc | -- | -- | |
| D Reeves Properties Llc | $106,000 | -- | |
| Miller Donald Gene | $83,000 | -- | |
| Bryd Heather R John W | $65,000 | -- | |
| Tucker Roger Dale Mary S | -- | -- | |
| Tucker Roger Dale Mary S | -- | -- | |
| Tucker Roger Dale Mary S | $40,500 | -- | |
| Callahan John C Alonza P | -- | -- | |
| Davis Virginia R | -- | -- |
Source: Public Records
Tax History Compared to Growth
Tax History
| Year | Tax Paid | Tax Assessment Tax Assessment Total Assessment is a certain percentage of the fair market value that is determined by local assessors to be the total taxable value of land and additions on the property. | Land | Improvement |
|---|---|---|---|---|
| 2025 | $415 | $90,200 | $69,900 | $20,300 |
| 2023 | $282 | $39,900 | $26,900 | $13,000 |
| 2022 | $278 | $39,900 | $26,900 | $13,000 |
| 2021 | $443 | $78,800 | $26,900 | $51,900 |
| 2020 | $516 | $81,600 | $33,700 | $47,900 |
| 2019 | $516 | $81,600 | $33,700 | $47,900 |
| 2018 | $516 | $81,600 | $33,700 | $47,900 |
| 2017 | $528 | $81,600 | $33,700 | $47,900 |
| 2016 | $617 | $89,100 | $39,700 | $49,400 |
| 2015 | $574 | $89,100 | $39,700 | $49,400 |
| 2014 | $564 | $89,100 | $39,700 | $49,400 |
Source: Public Records
Map
Nearby Homes
- 103 Shearin Hills Dr
- 5207 5207 Castle Hayne Rd Rd
- 3637 Lynn Ave
- 2 Castle Farms Rd
- 3 Castle Farms Rd
- 6505 Boatway Ct
- 304 Mary Ave
- 3420 Lynn Ave
- 1296 Sabal Palm St Unit Lot 472
- 1205 Pampas Grass Dr
- 1205 Pampas Grass Dr Unit Lot 462
- 112 Bavarian Dr
- 129 Brookgreen Rd
- 3451 Marathon Ave
- 3830 Sondey Rd
- 5011 Marathon Landing Ct
- 19 Creekstone Ln
- 1005 Pine Ridge Ct
- 1013 Pine Ridge Ct
- 316 Cherry Grove Ct
- 324 Cherry St Unit Lot 143
- 304 Cherry St Unit 148
- 312 Cherry St Unit 146
- 315 Cherry St Unit 141
- 320 Cherry St Unit Lot 144
- 316 Cherry St Unit 145
- 307 Cherry St Unit Lot 139
- 311 Cherry St Unit 140
- 319 Cherry St Unit 142
- 5406 Castle Hayne Rd
- 5500 Castle Hayne Rd
- 5400 Blossom St
- 3015 Castle Hayne Rd
- 1923 Castle Hayne Rd
- 5504 Castle Hayne Rd
- 5511 Blossom St
- 5412 Blossom St
- 5406 Blossom St
- 5500 Blossom St
- 5314 Castle Hayne Rd