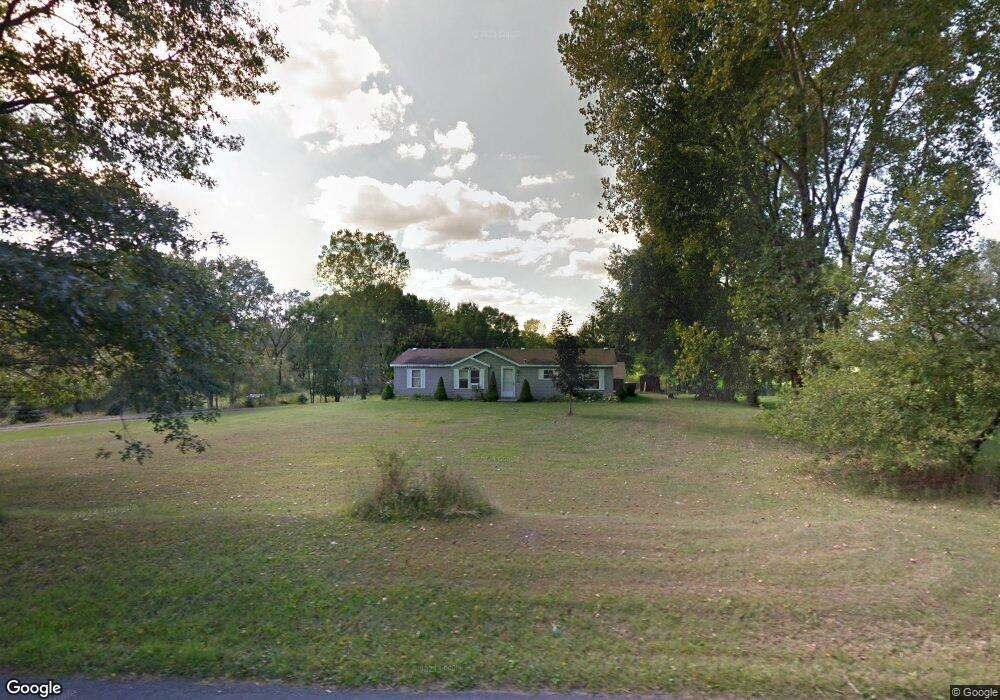
5410 Shepper Rd Stockbridge, MI 49285
Estimated Value: $208,948 - $268,000
3
Beds
2
Baths
1,404
Sq Ft
$171/Sq Ft
Est. Value
About This Home
This home is located at 5410 Shepper Rd, Stockbridge, MI 49285 and is currently estimated at $239,737, approximately $170 per square foot. 5410 Shepper Rd is a home located in Ingham County with nearby schools including Emma Smith Elementary School, Heritage School, and Stockbridge High School.
Ownership History
Date
Name
Owned For
Owner Type
Purchase Details
Closed on
Feb 13, 2024
Sold by
Vliet Caroline
Bought by
Bouck Roger and Bouck Jennifer A
Current Estimated Value
Purchase Details
Closed on
Jul 20, 2010
Sold by
Vliet Glenn and Vliet Caroline
Bought by
Bouck Roger and Bouck Jennifer
Purchase Details
Closed on
Mar 5, 2010
Sold by
Citimortgage Inc and Robinson Ester
Bought by
Vliet Caroline and Vliet Glenn
Purchase Details
Closed on
May 7, 2009
Sold by
Clay Christopher J and Frame Lorrie
Bought by
Citimortgage Inc
Purchase Details
Closed on
Jun 8, 2001
Sold by
Foster Danny R and Foster Denise E
Bought by
Clay Chris J and Clay Lorrie A
Home Financials for this Owner
Home Financials are based on the most recent Mortgage that was taken out on this home.
Original Mortgage
$111,050
Interest Rate
7.2%
Purchase Details
Closed on
Jul 18, 1994
Sold by
Cook James W
Bought by
Foster Danny and Foster Denise
Create a Home Valuation Report for This Property
The Home Valuation Report is an in-depth analysis detailing your home's value as well as a comparison with similar homes in the area
Home Values in the Area
Average Home Value in this Area
Purchase History
We collect this data history from publicly available records. To have your information removed, we recommend requesting removal directly through your county’s website.
| Date | Buyer | Sale Price | Title Company |
|---|---|---|---|
| Bouck Roger | -- | None Listed On Document | |
| Bouck Roger | -- | None Available | |
| Vliet Caroline | $25,000 | Heritage Title Services Llc | |
| Citimortgage Inc | $33,619 | None Available | |
| Clay Chris J | $117,000 | Landmark Title Services | |
| Foster Danny | $13,900 | -- |
Source: Public Records
Mortgage History
We collect this data history from publicly available records. To have your information removed, we recommend requesting removal directly through your county’s website.
| Date | Status | Borrower | Loan Amount |
|---|---|---|---|
| Previous Owner | Clay Chris J | $111,050 |
Source: Public Records
Tax History
| Year | Tax Paid | Tax Assessment Tax Assessment Total Assessment is a certain percentage of the fair market value that is determined by local assessors to be the total taxable value of land and additions on the property. | Land | Improvement |
|---|---|---|---|---|
| 2025 | $1,510 | $89,800 | $10,700 | $79,100 |
| 2024 | $5 | $89,300 | $10,200 | $79,100 |
| 2023 | $1,438 | $83,600 | $9,900 | $73,700 |
| 2022 | $1,355 | $72,900 | $9,500 | $63,400 |
| 2021 | $1,332 | $68,600 | $0 | $0 |
| 2020 | $1,302 | $65,900 | $0 | $0 |
| 2019 | $1,231 | $56,100 | $9,700 | $46,400 |
| 2018 | $1,221 | $46,400 | $8,900 | $37,500 |
| 2017 | $1,160 | $46,400 | $8,900 | $37,500 |
| 2016 | -- | $45,750 | $8,700 | $37,050 |
| 2015 | -- | $41,700 | $16,530 | $25,170 |
| 2014 | -- | $34,850 | $15,660 | $19,190 |
Source: Public Records
Map
Nearby Homes
- V L 00 Green Rd
- 5576 S M 52
- 617 Cherry St
- 410 S Center St
- 308 S Center St
- 311 S Clinton St
- 216 S Center St
- 414 Cherry St
- 4015 Eastbridge Rd
- 4010 Eastbridge Circle Rd
- 115 N Center St
- 4003 Eastbridge Rd
- 4059 Eastbridge Rd
- 630 W Main St W
- 17750 Michigan 106
- 000 Orlando Dr
- 0 Boyce Rd Unit 23126924
- 4845 Moechel Rd
- 12760 Roepke Rd
- 10137 Boyce Rd
- 5410 Shepper Rd Unit SHEPPER
- 5418 Shepper Rd
- 5420 Shepper Rd
- 5409 Shepper Rd
- 5404 Shepper Rd
- 5400 Shepper Rd
- 5417 Shepper Rd
- 5422 Shepper Rd
- 5427 Shepper Rd
- 5424 Shepper Rd
- 5444 Shepper Rd
- 5444 Shepper Rd
- 5439 Shepper Rd
- 5339 Shepper Rd
- 5425 Shepper Rd
- 5454 Shepper Rd
- 5441 Shepper Rd
- 5456 Shepper Rd
- 5436 Shepper Rd
- 5331 Shepper Rd
Your Personal Tour Guide
Ask me questions while you tour the home.