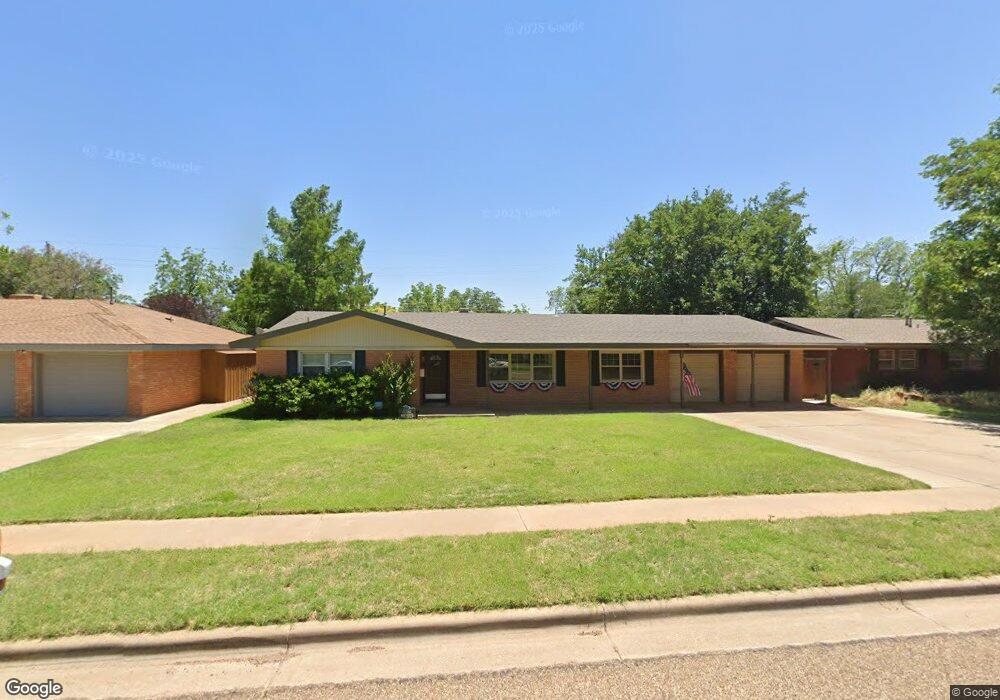
5411 27th St Lubbock, TX 79407
Bowie NeighborhoodEstimated Value: $277,000 - $336,000
4
Beds
3
Baths
2,874
Sq Ft
$105/Sq Ft
Est. Value
About This Home
This home is located at 5411 27th St, Lubbock, TX 79407 and is currently estimated at $301,128, approximately $104 per square foot. 5411 27th St is a home located in Lubbock County with nearby schools including Hardwick Elementary School, Mackenzie Middle School, and Coronado High School.
Ownership History
Date
Name
Owned For
Owner Type
Purchase Details
Closed on
May 28, 2021
Sold by
Delaney John and Delaney Terry
Bought by
Garrity Carolann
Current Estimated Value
Purchase Details
Closed on
Dec 23, 2008
Sold by
Womble Dustin R and Womble Leisha A
Bought by
Delaney John and Delaney Terry
Home Financials for this Owner
Home Financials are based on the most recent Mortgage that was taken out on this home.
Original Mortgage
$27,150
Interest Rate
5.99%
Mortgage Type
Stand Alone Second
Purchase Details
Closed on
May 11, 2007
Sold by
Kizer Norma S
Bought by
Womble Dustin R
Home Financials for this Owner
Home Financials are based on the most recent Mortgage that was taken out on this home.
Original Mortgage
$118,000
Interest Rate
6.16%
Mortgage Type
Purchase Money Mortgage
Purchase Details
Closed on
Dec 8, 1997
Sold by
Maxwell Virginia
Bought by
Delaney Terry and Delaney John
Create a Home Valuation Report for This Property
The Home Valuation Report is an in-depth analysis detailing your home's value as well as a comparison with similar homes in the area
Home Values in the Area
Average Home Value in this Area
Purchase History
| Date | Buyer | Sale Price | Title Company |
|---|---|---|---|
| Garrity Carolann | -- | None Available | |
| Delaney John | -- | Service Title | |
| Womble Dustin R | -- | Stc | |
| Delaney Terry | -- | -- |
Source: Public Records
Mortgage History
| Date | Status | Borrower | Loan Amount |
|---|---|---|---|
| Previous Owner | Delaney John | $27,150 | |
| Previous Owner | Delaney John | $144,800 | |
| Previous Owner | Womble Dustin R | $118,000 |
Source: Public Records
Tax History Compared to Growth
Tax History
| Year | Tax Paid | Tax Assessment Tax Assessment Total Assessment is a certain percentage of the fair market value that is determined by local assessors to be the total taxable value of land and additions on the property. | Land | Improvement |
|---|---|---|---|---|
| 2025 | $4,719 | $259,895 | $35,000 | $224,895 |
| 2024 | $4,719 | $259,895 | $35,000 | $224,895 |
| 2023 | $4,813 | $258,929 | $19,320 | $239,609 |
| 2022 | $4,801 | $237,146 | $19,320 | $217,826 |
| 2021 | $4,318 | $201,607 | $19,320 | $200,709 |
| 2020 | $3,985 | $183,279 | $19,320 | $163,959 |
| 2019 | $3,956 | $176,213 | $19,320 | $156,893 |
| 2018 | $3,802 | $169,145 | $19,320 | $149,825 |
| 2017 | $3,489 | $155,010 | $19,320 | $135,690 |
| 2016 | $3,768 | $167,393 | $10,500 | $156,893 |
| 2015 | $3,132 | $155,805 | $10,500 | $145,305 |
| 2014 | $3,132 | $149,200 | $10,500 | $138,700 |
Source: Public Records
Map
Nearby Homes
- 5415 27th St
- 5424 27th St
- 5415 26th St
- 5426 28th St
- 10527 Bangor Ave
- 5219 26th St
- 5428 25th St
- 5424 31st St
- 8610 24th St
- 5301 24th St
- 2416 Aberdeen Ave
- 2418 Aberdeen Ave
- 2414 Aberdeen Ave
- 2408 Aberdeen Ave
- 2412 Aberdeen Ave
- 2410 Aberdeen Ave
- 2420 Aberdeen Ave
- 2422 Aberdeen Ave
- 2411 Aberdeen Ave
- 2409 Aberdeen Ave