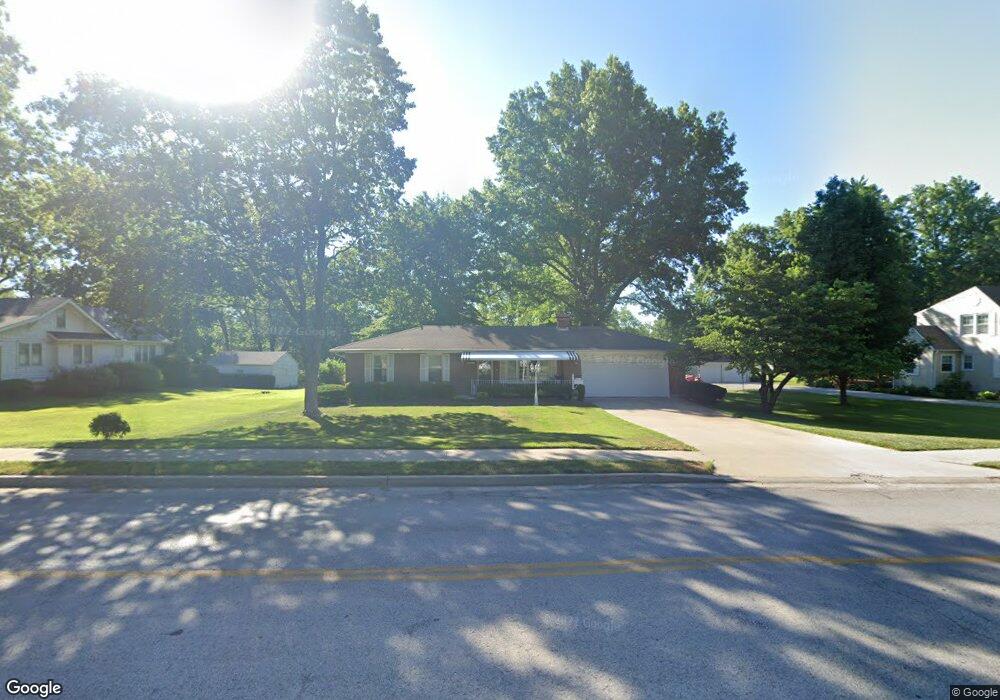
5411 Blue Ridge Blvd Raytown, MO 64133
Estimated Value: $214,000 - $241,000
3
Beds
2
Baths
1,145
Sq Ft
$202/Sq Ft
Est. Value
About This Home
This home is located at 5411 Blue Ridge Blvd, Raytown, MO 64133 and is currently estimated at $231,016, approximately $201 per square foot. 5411 Blue Ridge Blvd is a home located in Jackson County with nearby schools including Fleetridge Elementary School, Raytown Middle School, and Raytown South High School.
Ownership History
Date
Name
Owned For
Owner Type
Purchase Details
Closed on
Feb 26, 2010
Sold by
Cummings Bonnie R and Hamm Linda K
Bought by
Taylor Lincoln R and Taylor Etta M
Current Estimated Value
Home Financials for this Owner
Home Financials are based on the most recent Mortgage that was taken out on this home.
Original Mortgage
$82,085
Outstanding Balance
$54,190
Interest Rate
4.98%
Mortgage Type
FHA
Estimated Equity
$176,826
Purchase Details
Closed on
Nov 22, 2006
Sold by
Cummings Bonnie R
Bought by
Cummings Bonnie R and Hamm Linda K
Purchase Details
Closed on
Feb 28, 2003
Sold by
Luff William W
Bought by
Cummings Bonnie R
Home Financials for this Owner
Home Financials are based on the most recent Mortgage that was taken out on this home.
Original Mortgage
$80,000
Interest Rate
5.93%
Mortgage Type
Purchase Money Mortgage
Create a Home Valuation Report for This Property
The Home Valuation Report is an in-depth analysis detailing your home's value as well as a comparison with similar homes in the area
Home Values in the Area
Average Home Value in this Area
Purchase History
| Date | Buyer | Sale Price | Title Company |
|---|---|---|---|
| Taylor Lincoln R | -- | Chicago | |
| Cummings Bonnie R | -- | None Available | |
| Cummings Bonnie R | -- | -- |
Source: Public Records
Mortgage History
| Date | Status | Borrower | Loan Amount |
|---|---|---|---|
| Open | Taylor Lincoln R | $82,085 | |
| Previous Owner | Cummings Bonnie R | $80,000 |
Source: Public Records
Tax History
| Year | Tax Paid | Tax Assessment Tax Assessment Total Assessment is a certain percentage of the fair market value that is determined by local assessors to be the total taxable value of land and additions on the property. | Land | Improvement |
|---|---|---|---|---|
| 2025 | $2,769 | $35,296 | $7,733 | $27,563 |
| 2024 | $2,750 | $30,693 | $8,725 | $21,968 |
| 2023 | $2,750 | $30,693 | $3,325 | $27,368 |
| 2022 | $2,645 | $28,120 | $6,504 | $21,616 |
| 2021 | $2,654 | $28,120 | $6,504 | $21,616 |
| 2020 | $2,543 | $26,685 | $6,504 | $20,181 |
| 2019 | $2,530 | $26,685 | $6,504 | $20,181 |
| 2018 | $2,126 | $23,225 | $5,661 | $17,564 |
| 2016 | $2,061 | $22,643 | $5,480 | $17,163 |
Source: Public Records
Map
Nearby Homes
- 11029 E 53rd Terrace
- 11013 E 53rd Terrace
- 5608 Woodson Rd
- 5425 Appleton Ave
- 5305 Ridgeway Ave
- 11108 E 57th St
- 5117 Woodson Rd
- 11405 E 51 St S
- 11412 E 58th St
- 12124 E 54th St
- 5805 Ridgeway Ave
- 5212 Hedges Ave
- 5433 Willow Ave
- 4423 Crysler Ave
- 10600 E 51st St
- 11308 E 50th St
- 5110 Willow Ave
- 11215 E 49th St
- 10905 E 59th St
- 5923 Ridgeway Ave
- 5415 Blue Ridge Blvd
- 5407 Blue Ridge Blvd
- 5406 Blue Ridge Blvd
- 5402 Blue Ridge Blvd
- 5417 Blue Ridge Blvd
- 5405 Blue Ridge Blvd
- 5408 Blue Ridge Blvd
- 5423 Blue Ridge Blvd
- 5410 Blue Ridge Blvd
- 5400 Blue Ridge Blvd
- 5501 Blue Ridge Blvd
- 11312 E 55th Terrace
- 5414 Blue Ridge Blvd
- 5421 Sterling Ave
- 5380 Blue Ridge Blvd
- 5388 Blue Ridge Blvd
- 5417 Sterling Ave
- 5413 Sterling Ave
- 5505 Blue Ridge Blvd
- 5500 Blue Ridge Blvd
Your Personal Tour Guide
Ask me questions while you tour the home.