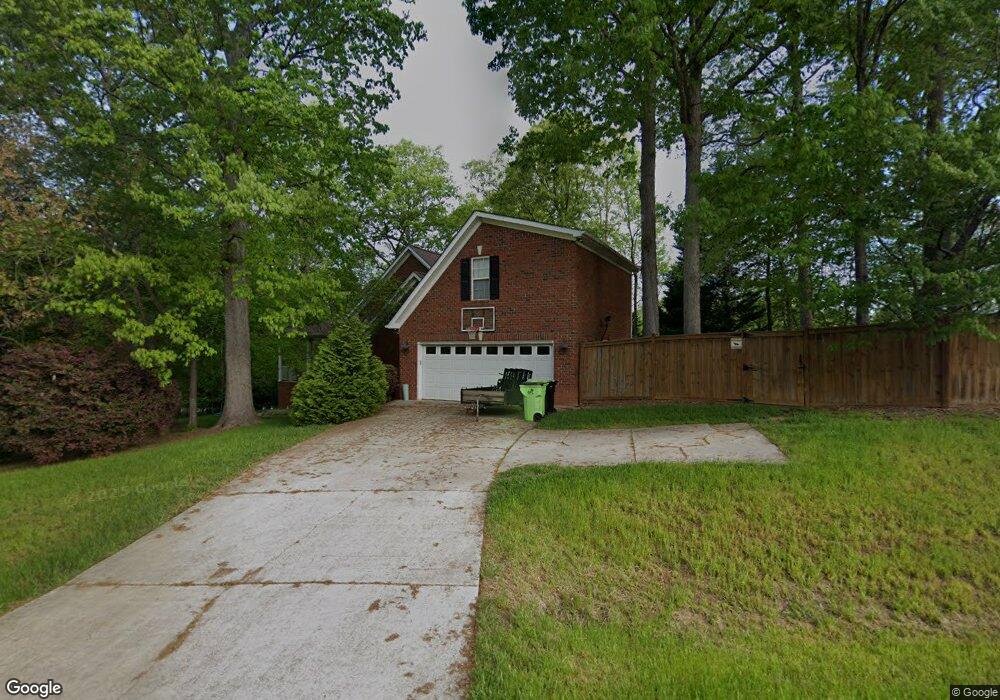
5412 Cazelet Ct Garner, NC 27529
Estimated Value: $502,000 - $607,000
3
Beds
3
Baths
2,975
Sq Ft
$192/Sq Ft
Est. Value
About This Home
This home is located at 5412 Cazelet Ct, Garner, NC 27529 and is currently estimated at $571,877, approximately $192 per square foot. 5412 Cazelet Ct is a home located in Wake County with nearby schools including Aversboro Elementary, East Garner Middle School, and South Garner High.
Ownership History
Date
Name
Owned For
Owner Type
Purchase Details
Closed on
Jun 26, 2015
Sold by
Prieskorn Michael and Prieskorn Sue
Bought by
Thomas Neil and Thomas Meaghan
Current Estimated Value
Home Financials for this Owner
Home Financials are based on the most recent Mortgage that was taken out on this home.
Original Mortgage
$282,254
Outstanding Balance
$219,235
Interest Rate
3.75%
Mortgage Type
FHA
Estimated Equity
$352,642
Purchase Details
Closed on
May 8, 2000
Sold by
Sierra Builders Inc
Bought by
Prieskorn Michael and Prieskorn Sue
Home Financials for this Owner
Home Financials are based on the most recent Mortgage that was taken out on this home.
Original Mortgage
$201,600
Interest Rate
8.23%
Mortgage Type
Stand Alone First
Purchase Details
Closed on
Jul 1, 1999
Sold by
T H Turner Farms Inc
Bought by
Sierra Builders Inc
Home Financials for this Owner
Home Financials are based on the most recent Mortgage that was taken out on this home.
Original Mortgage
$34,000
Interest Rate
7.23%
Create a Home Valuation Report for This Property
The Home Valuation Report is an in-depth analysis detailing your home's value as well as a comparison with similar homes in the area
Home Values in the Area
Average Home Value in this Area
Purchase History
We collect this data history from publicly available records. To have your information removed, we recommend requesting removal directly through your county’s website.
| Date | Buyer | Sale Price | Title Company |
|---|---|---|---|
| Thomas Neil | $292,000 | Attorney | |
| Prieskorn Michael | $252,000 | Fidelity National Title Co | |
| Sierra Builders Inc | $34,000 | -- |
Source: Public Records
Mortgage History
We collect this data history from publicly available records. To have your information removed, we recommend requesting removal directly through your county’s website.
| Date | Status | Borrower | Loan Amount |
|---|---|---|---|
| Open | Thomas Neil | $282,254 | |
| Previous Owner | Prieskorn Michael | $201,600 | |
| Previous Owner | Sierra Builders Inc | $34,000 | |
| Closed | Prieskorn Michael | $25,200 |
Source: Public Records
Tax History
| Year | Tax Paid | Tax Assessment Tax Assessment Total Assessment is a certain percentage of the fair market value that is determined by local assessors to be the total taxable value of land and additions on the property. | Land | Improvement |
|---|---|---|---|---|
| 2025 | $3,653 | $568,045 | $110,000 | $458,045 |
| 2024 | $3,548 | $568,045 | $110,000 | $458,045 |
| 2023 | $2,701 | $343,828 | $42,000 | $301,828 |
| 2022 | $2,503 | $343,828 | $42,000 | $301,828 |
| 2021 | $2,436 | $343,828 | $42,000 | $301,828 |
| 2020 | $2,396 | $343,828 | $42,000 | $301,828 |
| 2019 | $2,489 | $302,333 | $40,000 | $262,333 |
| 2018 | $2,289 | $302,333 | $40,000 | $262,333 |
| 2017 | $2,170 | $302,333 | $40,000 | $262,333 |
| 2016 | $2,126 | $302,333 | $40,000 | $262,333 |
| 2015 | $131 | $359,259 | $48,000 | $311,259 |
| 2014 | $2,384 | $359,259 | $48,000 | $311,259 |
Source: Public Records
Map
Nearby Homes
- 5552 Fantasy Moth Dr
- 5540 Fantasy Moth Dr
- 5236 Hartfelt Dr
- 5520 Fantasy Moth Dr
- 5441 Fantasy Moth Dr
- 5412 Treebound Ct
- 3760 Wakefield Ln
- 101 Brody Pine Way
- 413 Pierce Landing Dr
- 440 Pierce Landing Dr
- 1604 Red Brick Rd
- 1009 Open Field Dr
- 1205 Magnolia Hill Rd
- 1040 Saint Lawrence Dr
- 1036 Saint Lawrence Dr
- 1028 Saint Lawrence Dr
- 1032 Saint Lawrence Dr
- 1045 Saint Lawrence Dr
- 773 Red River Dr
- 1041 Saint Lawrence Dr
- 1308 Rhea Dr
- 1216 Rhea Dr
- 5401 Cazelet Ct
- 5409 Cazelet Ct
- 1312 Rhea Dr
- 1305 Rhea Dr
- 1217 Rhea Dr
- 5400 Cazelet Ct
- 5416 Quetzel Ct
- 5412 Quetzel Ct
- 5405 Cazelet Ct
- 5408 Quetzel Ct
- 1316 Rhea Dr
- 1313 Rhea Dr
- 1205 Rhea Dr
- 5404 Quetzel Ct
- 5316 Rolling Field Dr
- 5312 Rolling Field Dr
- 5417 Quetzel Ct
- 5320 Rolling Field Dr
Your Personal Tour Guide
Ask me questions while you tour the home.