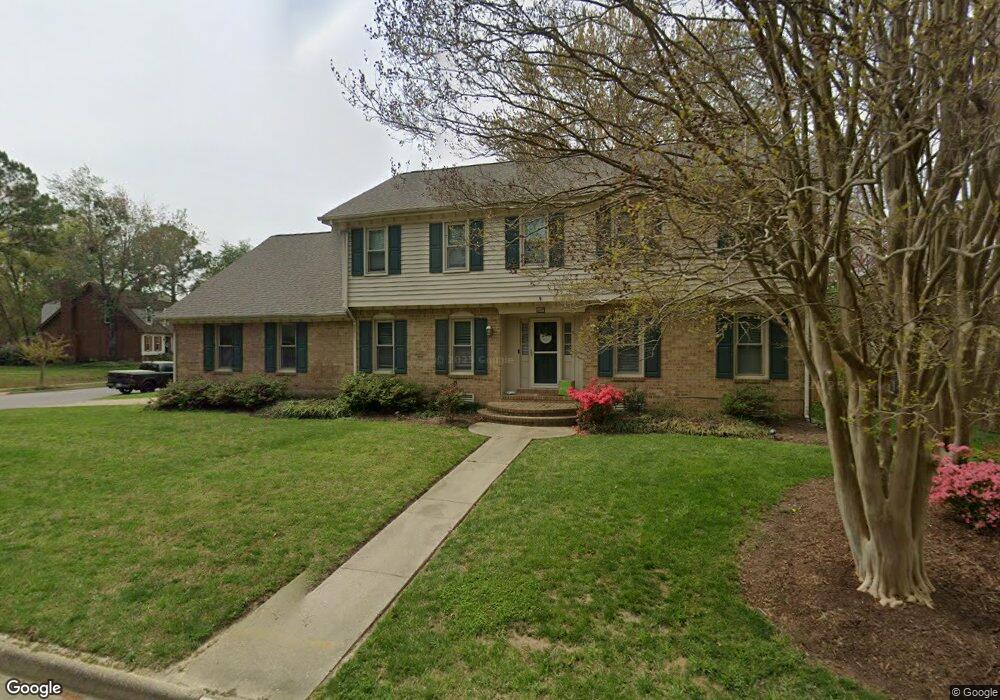
5412 Hargrove Blvd Virginia Beach, VA 23464
Estimated Value: $603,467 - $672,000
6
Beds
4
Baths
3,319
Sq Ft
$195/Sq Ft
Est. Value
About This Home
This home is located at 5412 Hargrove Blvd, Virginia Beach, VA 23464 and is currently estimated at $646,867, approximately $194 per square foot. 5412 Hargrove Blvd is a home located in Virginia Beach City with nearby schools including Fairfield Elementary School, Kempsville Middle School, and Kempsville High School.
Ownership History
Date
Name
Owned For
Owner Type
Purchase Details
Closed on
Nov 7, 2020
Sold by
Hull Richard A and Hull Katelyn M
Bought by
Farricker Christopher Michael and Farricker Mary
Current Estimated Value
Home Financials for this Owner
Home Financials are based on the most recent Mortgage that was taken out on this home.
Original Mortgage
$462,962
Outstanding Balance
$411,970
Interest Rate
2.8%
Mortgage Type
New Conventional
Estimated Equity
$234,897
Purchase Details
Closed on
Jan 17, 2019
Sold by
Boorujy James R and Boorujy Alison S
Bought by
Hull Richard A and Hull Katelyn M
Home Financials for this Owner
Home Financials are based on the most recent Mortgage that was taken out on this home.
Original Mortgage
$371,139
Interest Rate
4.5%
Mortgage Type
VA
Create a Home Valuation Report for This Property
The Home Valuation Report is an in-depth analysis detailing your home's value as well as a comparison with similar homes in the area
Home Values in the Area
Average Home Value in this Area
Purchase History
| Date | Buyer | Sale Price | Title Company |
|---|---|---|---|
| Farricker Christopher Michael | $455,000 | Fidelity National Ttl Ins Co | |
| Hull Richard A | $384,900 | Priority Title & Escrow Llc |
Source: Public Records
Mortgage History
| Date | Status | Borrower | Loan Amount |
|---|---|---|---|
| Open | Farricker Christopher Michael | $462,962 | |
| Previous Owner | Hull Richard A | $371,139 |
Source: Public Records
Tax History Compared to Growth
Tax History
| Year | Tax Paid | Tax Assessment Tax Assessment Total Assessment is a certain percentage of the fair market value that is determined by local assessors to be the total taxable value of land and additions on the property. | Land | Improvement |
|---|---|---|---|---|
| 2025 | $4,958 | $546,700 | $165,000 | $381,700 |
| 2024 | $4,958 | $511,100 | $165,000 | $346,100 |
| 2023 | $4,415 | $446,000 | $153,000 | $293,000 |
| 2022 | $4,157 | $419,900 | $136,000 | $283,900 |
| 2021 | $4,117 | $415,900 | $132,000 | $283,900 |
| 2020 | $4,189 | $411,700 | $132,000 | $279,700 |
| 2019 | $4,062 | $386,100 | $125,600 | $260,500 |
| 2018 | $3,871 | $386,100 | $125,600 | $260,500 |
| 2017 | $3,724 | $371,500 | $119,300 | $252,200 |
| 2016 | $3,570 | $360,600 | $119,300 | $241,300 |
| 2015 | $3,488 | $352,300 | $119,300 | $233,000 |
| 2014 | $3,426 | $364,600 | $128,800 | $235,800 |
Source: Public Records
Map
Nearby Homes
- 5448 Todd St
- 700 Achilles Ct
- 5489 Hargrove Blvd
- 405 Count Fleet Cir
- 813 Oglesby Ct
- 701 Skipwith Rd
- 5630 Gates Landing Rd
- 609 Avalon Ave
- 5517 Old Providence Rd
- 313 King Christian Rd
- 5708 Normandy Ave
- 325 Busher Rd
- 685 Lord Dunmore Dr
- 5721 Oak Terrace Dr
- 720 Lord Dunmore Dr
- 5304 Gale Dr
- 670 Lord Dunmore Dr
- 928 Old Homestead Ln
- 5424 Susquehanna Dr
- 568 Sterling Rd
- 5420 Todd St
- 5400 Hargrove Blvd
- 5420 Hargrove Blvd
- 5425 Todd St
- 5405 Hargrove Blvd
- 5396 Hargrove Blvd
- 5424 Todd St
- 5409 Hargrove Blvd
- 5401 Hargrove Blvd
- 5429 Todd St
- 5424 Hargrove Blvd
- 5413 Hargrove Blvd
- 5392 Hargrove Blvd
- 5428 Todd St
- 5397 Hargrove Blvd
- 605 Reasor Dr
- 5428 Hargrove Blvd
- 5417 Hargrove Blvd
- 636 Whitehurst Landing Rd
- 640 Whitehurst Landing Rd