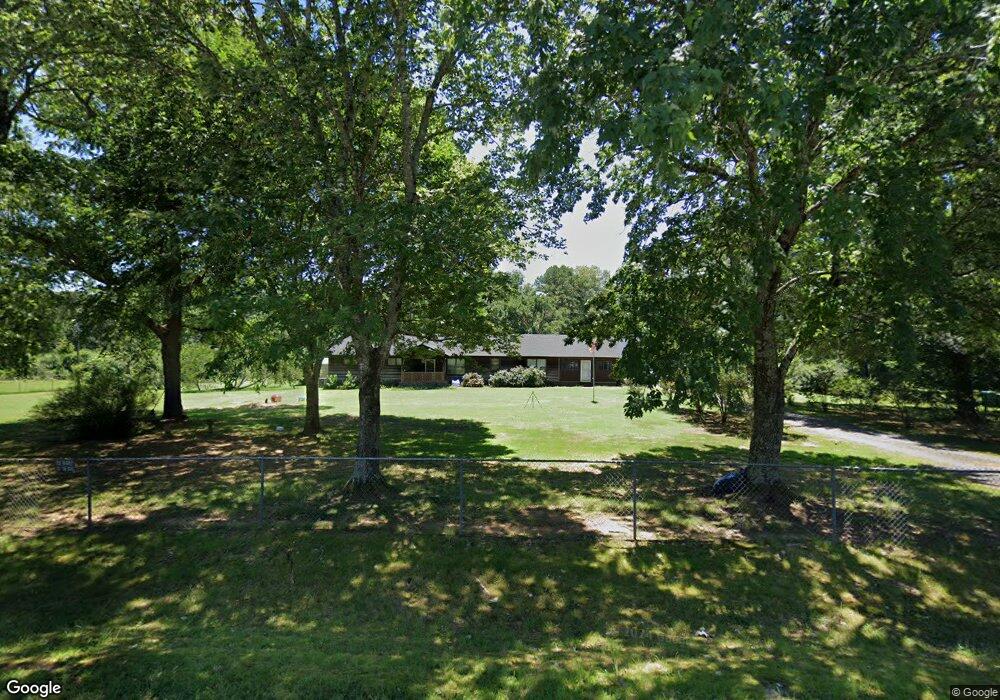
5415 Kuykendall Rd Jacksonville, AR 72076
Estimated Value: $245,000 - $296,000
--
Bed
1
Bath
2,488
Sq Ft
$107/Sq Ft
Est. Value
About This Home
This home is located at 5415 Kuykendall Rd, Jacksonville, AR 72076 and is currently estimated at $265,766, approximately $106 per square foot. 5415 Kuykendall Rd is a home located in Pulaski County with nearby schools including Bayou Meto Elementary School, Jacksonville Middle School, and Jacksonville High School.
Ownership History
Date
Name
Owned For
Owner Type
Purchase Details
Closed on
Sep 8, 2025
Sold by
Ultra Holdings Llc
Bought by
Rei Realty Llc
Current Estimated Value
Home Financials for this Owner
Home Financials are based on the most recent Mortgage that was taken out on this home.
Original Mortgage
$4,924,304
Outstanding Balance
$4,800,201
Interest Rate
6.58%
Mortgage Type
New Conventional
Estimated Equity
-$4,534,435
Purchase Details
Closed on
Apr 22, 2021
Sold by
Flores Ruben and Estate Of Mark Allan Flores
Bought by
Burks Celina A and Howard David R
Purchase Details
Closed on
Jun 5, 2018
Sold by
Ultra Holdings Llc
Bought by
Reyes Nicomedes and Reyes Kimberly
Purchase Details
Closed on
Sep 19, 2017
Sold by
Blessed Investor Property Team Llc
Bought by
Ultra Holdings Llc
Purchase Details
Closed on
Jul 24, 2014
Sold by
Bright Richard L O
Bought by
Bright Richard L O and Bright Linda G O
Create a Home Valuation Report for This Property
The Home Valuation Report is an in-depth analysis detailing your home's value as well as a comparison with similar homes in the area
Home Values in the Area
Average Home Value in this Area
Purchase History
| Date | Buyer | Sale Price | Title Company |
|---|---|---|---|
| Rei Realty Llc | $4,347,693 | American Abstract & Title | |
| Burks Celina A | $21,000 | United Abstract & Ttl Co Inc | |
| Reyes Nicomedes | $105,000 | None Listed On Document | |
| Ultra Holdings Llc | $77,000 | American Abstract & Title Co | |
| Bright Richard L O | -- | None Available |
Source: Public Records
Mortgage History
| Date | Status | Borrower | Loan Amount |
|---|---|---|---|
| Open | Rei Realty Llc | $4,924,304 |
Source: Public Records
Tax History Compared to Growth
Tax History
| Year | Tax Paid | Tax Assessment Tax Assessment Total Assessment is a certain percentage of the fair market value that is determined by local assessors to be the total taxable value of land and additions on the property. | Land | Improvement |
|---|---|---|---|---|
| 2025 | $2,759 | $47,237 | $2,368 | $44,869 |
| 2024 | $1,922 | $47,237 | $2,368 | $44,869 |
| 2023 | $1,922 | $47,237 | $2,368 | $44,869 |
| 2022 | $2,268 | $47,237 | $2,368 | $44,869 |
| 2021 | $1,989 | $31,527 | $2,220 | $29,307 |
| 2020 | $1,918 | $30,310 | $2,220 | $28,090 |
| 2019 | $1,918 | $30,310 | $2,220 | $28,090 |
| 2018 | $1,884 | $30,310 | $2,220 | $28,090 |
| 2017 | $714 | $30,310 | $2,220 | $28,090 |
| 2016 | $114 | $26,440 | $2,960 | $23,480 |
| 2015 | $1,139 | $26,156 | $2,960 | $23,196 |
| 2014 | $1,139 | $22,416 | $2,960 | $19,456 |
Source: Public Records
Map
Nearby Homes
- 6233 Reeves Ln Unit North Pulaski County
- 6111 Langley Dr
- 5400 Jim Hall Rd
- 5817 Jacksonville Conway Rd
- 5907 Jacksonville-Conway Rd
- 5917 Jacksonville-Conway Rd
- 9215 Jacksonville-Conway Rd
- 5523 Jacksonville Conway Rd
- 4418 Lena Ln
- 115 Coty
- 3801 W Maddox Rd Unit North Pulaski county
- 10979 Old Tom Box Rd
- 10775 Old Tom Box Rd
- 10876 Old Tom Box Rd
- 10794 Old Tom Box Rd
- 10789 Old Tom Box Rd
- 11099 Old Tom Box Rd
- 3520 Lena Ln
- 000 Hatcher Rd
- 0000 Hatcher Rd
- 5403 Kuykendall Rd
- 5511 Kuykendall Rd
- 5313 Kuykendall Rd
- 5414 Kuykendall Rd
- 5408 Kuykendall Rd
- 5307 Kuykendall Rd
- 5402 Kuykendall Rd
- 5514 Kuykendall Rd
- 5303 Kuykendall Rd
- 5312 Kuykendall Rd
- 22105 Highway 107
- 22105B Highway 107
- 5306 Kuykendall Rd
- 0 Kuykendall
- 5211 Kuykendall Rd
- 5302 Kuykendall Rd
- 5210 Kuykendall Rd
- 5204 Kuykendall Rd
- 5408 Lynne Dr
- 6001 Old Tom Box Rd