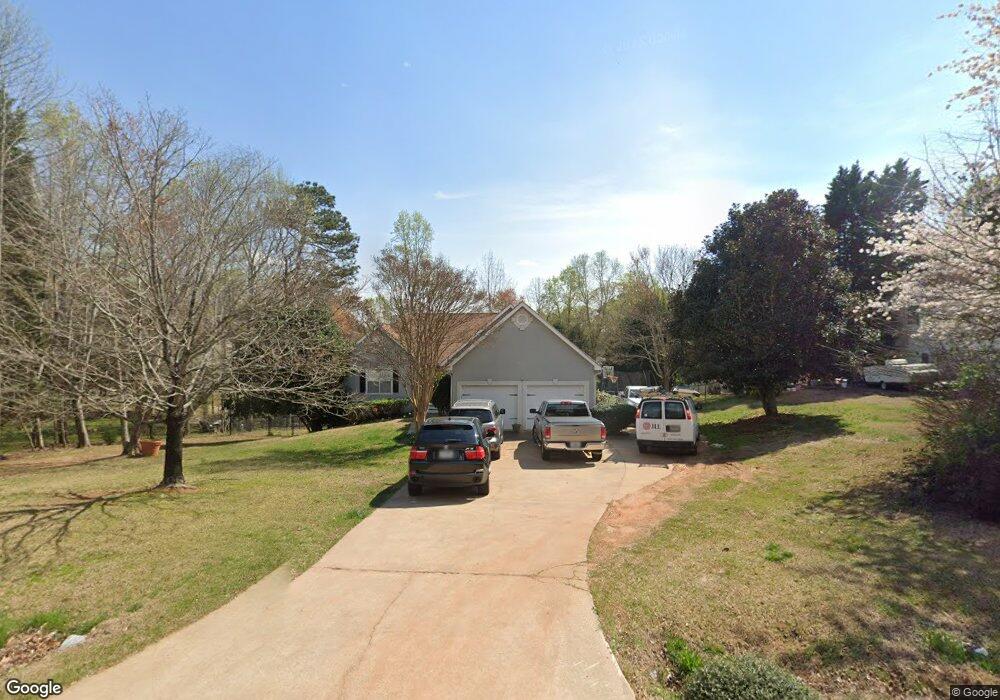
5415 Pilgrim Point Rd Cumming, GA 30041
Lake Lanier NeighborhoodEstimated Value: $442,178 - $575,000
3
Beds
2
Baths
1,539
Sq Ft
$321/Sq Ft
Est. Value
About This Home
This home is located at 5415 Pilgrim Point Rd, Cumming, GA 30041 and is currently estimated at $494,545, approximately $321 per square foot. 5415 Pilgrim Point Rd is a home located in Forsyth County with nearby schools including Chattahoochee Elementary School and Little Mill Middle School.
Ownership History
Date
Name
Owned For
Owner Type
Purchase Details
Closed on
Aug 6, 2012
Sold by
Samuel James
Bought by
Pitts Donnell and Pitts Donnice
Current Estimated Value
Purchase Details
Closed on
Feb 18, 2003
Sold by
Major Jannie
Bought by
Samuel James O
Home Financials for this Owner
Home Financials are based on the most recent Mortgage that was taken out on this home.
Original Mortgage
$149,600
Interest Rate
5.88%
Mortgage Type
New Conventional
Purchase Details
Closed on
Mar 2, 2001
Sold by
Maclaughlin Peter D and Maclaughlin Tammy Y
Bought by
Major Jannie
Home Financials for this Owner
Home Financials are based on the most recent Mortgage that was taken out on this home.
Original Mortgage
$128,000
Interest Rate
7.12%
Mortgage Type
New Conventional
Purchase Details
Closed on
Dec 16, 1998
Sold by
Preston Jr Iowa H
Bought by
Ragaldo Fernando and Ragaldo Magdelana
Purchase Details
Closed on
Dec 28, 1995
Sold by
Glover Homes
Bought by
Maclaughlin Peter D Tammy T
Create a Home Valuation Report for This Property
The Home Valuation Report is an in-depth analysis detailing your home's value as well as a comparison with similar homes in the area
Home Values in the Area
Average Home Value in this Area
Purchase History
| Date | Buyer | Sale Price | Title Company |
|---|---|---|---|
| Pitts Donnell | -- | -- | |
| Samuel James O | $187,000 | -- | |
| Major Jannie | $160,000 | -- | |
| Ragaldo Fernando | $105,000 | -- | |
| Maclaughlin Peter D Tammy T | $118,900 | -- |
Source: Public Records
Mortgage History
| Date | Status | Borrower | Loan Amount |
|---|---|---|---|
| Previous Owner | Samuel James O | $149,600 | |
| Previous Owner | Major Jannie | $128,000 | |
| Closed | Maclaughlin Peter D Tammy T | $0 | |
| Closed | Ragaldo Fernando | -- |
Source: Public Records
Tax History Compared to Growth
Tax History
| Year | Tax Paid | Tax Assessment Tax Assessment Total Assessment is a certain percentage of the fair market value that is determined by local assessors to be the total taxable value of land and additions on the property. | Land | Improvement |
|---|---|---|---|---|
| 2025 | $4,249 | $187,120 | $50,000 | $137,120 |
| 2024 | $4,249 | $173,280 | $46,000 | $127,280 |
| 2023 | $4,026 | $163,552 | $40,000 | $123,552 |
| 2022 | $3,727 | $108,008 | $24,000 | $84,008 |
| 2021 | $2,983 | $108,008 | $24,000 | $84,008 |
| 2020 | $2,801 | $101,432 | $22,000 | $79,432 |
| 2019 | $3,428 | $123,972 | $22,000 | $101,972 |
| 2018 | $2,671 | $96,596 | $22,000 | $74,596 |
| 2017 | $2,209 | $79,592 | $18,000 | $61,592 |
| 2016 | $2,153 | $77,592 | $16,000 | $61,592 |
| 2015 | $2,046 | $73,592 | $12,000 | $61,592 |
| 2014 | $1,812 | $68,456 | $12,000 | $56,456 |
Source: Public Records
Map
Nearby Homes
- 5345 Pilgrim Point Rd
- 0 Mercedes Dr Unit 7660832
- 5560 Pilgrim Point Extension
- 5425 Belvedere St
- 5380 Renault St
- 5660 Mercedes Dr
- 4710 Chevy St
- 4050 Vintage Ct
- 2120 Shaffer Rd
- 4040 Merritt Dr
- 4045 Merritt Dr
- 2220 Peachtree Rd
- 2320 Pilgrim Mill Way
- 1965 Tiner Ct
- 2955 Pilgrim Mill Rd
- 3045 Imperial Dr
- 4265 Sinclair Shores Rd
- 2195 Pinetree Dr
- 2860 Pilgrim Mill Rd
- 5415 Pilgrim Pt Rd
- 5425 Pilgrim Point Rd
- 5405 Pilgrim Point Rd
- 5440 Linger Longer Rd Unit 3
- 5435 Pilgrim Point Rd Unit I
- 5420 Pilgrim Point Rd Unit 3
- 5410 Pilgrim Point Rd
- 5430 Pilgrim Point Rd Unit III
- 5445 Pilgrim Point Rd Unit 1
- 5470 Linger Longer Rd
- 5470 Linger Longer Rd Unit 3
- 5460 Linger Longer Rd
- 5435 Linger Longer Rd
- 5404 Pilgrim Point Rd
- 5440 Pilgrim Point Rd Unit 111
- 5425 Linger Longer Rd
- 5445 Linger Longer Rd
- 5480 Linger Longer Rd Unit 3
- 5455 Linger Longer Rd
- 0 Renault St Unit 20