5415 W Ellsworth Rd Deer Park, WA 99006
Estimated Value: $427,859 - $571,000
4
Beds
3
Baths
2,100
Sq Ft
$237/Sq Ft
Est. Value
About This Home
This home is located at 5415 W Ellsworth Rd, Deer Park, WA 99006 and is currently estimated at $497,965, approximately $237 per square foot. 5415 W Ellsworth Rd is a home located in Stevens County with nearby schools including Deer Park Home Link Program, Arcadia Elementary School, and Deer Park Elementary School.
Ownership History
Date
Name
Owned For
Owner Type
Purchase Details
Closed on
May 9, 2025
Sold by
Carpenter Lynda K
Bought by
Carpenter Revocable Living Trust and Carpenter
Current Estimated Value
Purchase Details
Closed on
Dec 27, 2019
Sold by
Carpenter Lynda K and Carpenter William J
Bought by
Carpenter Lynda K
Home Financials for this Owner
Home Financials are based on the most recent Mortgage that was taken out on this home.
Original Mortgage
$168,236
Interest Rate
3.6%
Mortgage Type
VA
Purchase Details
Closed on
Jul 30, 2014
Sold by
Kazikiewicz Thomas J
Bought by
Carpenter William J and Carpenter Lynda K
Home Financials for this Owner
Home Financials are based on the most recent Mortgage that was taken out on this home.
Original Mortgage
$189,000
Interest Rate
4.12%
Mortgage Type
VA
Create a Home Valuation Report for This Property
The Home Valuation Report is an in-depth analysis detailing your home's value as well as a comparison with similar homes in the area
Home Values in the Area
Average Home Value in this Area
Purchase History
| Date | Buyer | Sale Price | Title Company |
|---|---|---|---|
| Carpenter Revocable Living Trust | -- | None Listed On Document | |
| Carpenter Lynda K | -- | Stevens County Title Company | |
| Carpenter William J | $189,000 | Stevens County Title Company |
Source: Public Records
Mortgage History
| Date | Status | Borrower | Loan Amount |
|---|---|---|---|
| Previous Owner | Carpenter Lynda K | $168,236 | |
| Previous Owner | Carpenter William J | $189,000 |
Source: Public Records
Tax History Compared to Growth
Tax History
| Year | Tax Paid | Tax Assessment Tax Assessment Total Assessment is a certain percentage of the fair market value that is determined by local assessors to be the total taxable value of land and additions on the property. | Land | Improvement |
|---|---|---|---|---|
| 2024 | $2,690 | $290,819 | $85,680 | $205,139 |
| 2023 | $2,632 | $285,987 | $76,160 | $209,827 |
| 2022 | $2,376 | $235,378 | $76,160 | $159,218 |
| 2021 | $2,296 | $197,705 | $42,840 | $154,865 |
| 2020 | $2,387 | $197,705 | $42,840 | $154,865 |
| 2019 | $2,262 | $194,314 | $42,840 | $151,474 |
| 2018 | $2,574 | $180,866 | $42,840 | $138,026 |
| 2017 | $2,428 | $188,100 | $42,840 | $145,260 |
| 2016 | $1,882 | $188,100 | $42,840 | $145,260 |
| 2015 | $1,884 | $141,472 | $33,320 | $108,152 |
| 2013 | -- | $141,472 | $33,320 | $108,152 |
Source: Public Records
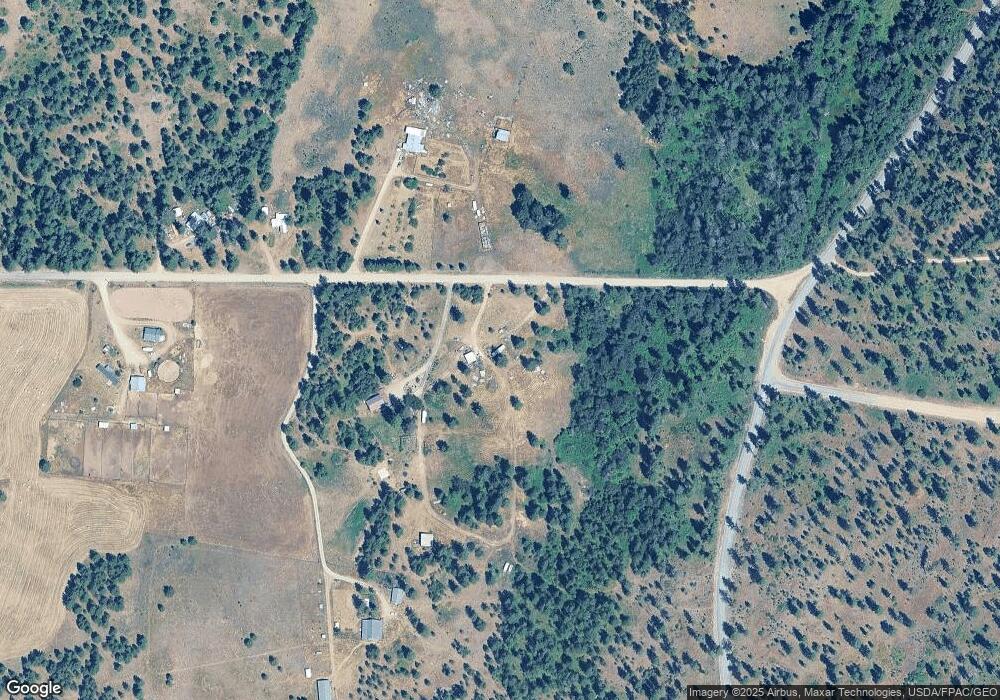
Map
Nearby Homes
- nka Rocky Top Way
- 6581 Saddle Mountain Way
- XX Blueridge Way Unit LOT 38
- 5475 Peggy Way
- 5426C Peggy Way
- 6700 Saddle Mountain Way
- 52XX S Lot 8 Swenson Rd
- 6526 Summerlin Way
- 52XX S Lot 7 Swenson Rd
- 5192 S Swenson Rd
- 6265 W Bluebird Way
- 6282 W Bluebird Way
- 6650 Blueridge Way
- 6601 Stony Way
- 6520 B Pine Ridge Way
- 6520 Pine Ridge Way
- 6471 Hilltop Dr
- 6671 Blueridge Way
- 6712 Washington 291
- 6299 Sundown Rd
- 5415 W Ellsworth Rd
- 5122 Ellsworth Rd
- 0000 Ellsworth Rd
- 5423 W Ellsworth Rd
- XXXX Ellsworth Rd
- 5422 W Ellsworth Rd
- 5422 W Glen Grove Staley Rd
- 5464 W Glen Grove Staley Rd
- 5446 W Ellsworth Rd
- 5476 W Glen Grove-Staley Rd
- 5474 W Glen Grove Staley Rd
- 5488 W Glen Grove Staley Rd
- 5488 W Glen Grove-Staley Rd
- 5450 W Glen Grove Staley Rd
- 5546 Ellsworth Rd
- 5397 W Glen Grove Staley Rd
- 5467 W Glen Grove Staley Rd
- TBD W Glen Grove Staley Rd Unit Parcel C
- 5379 W Glen Grove Staley Rd
- 5502 W Glen Grove Staley Rd