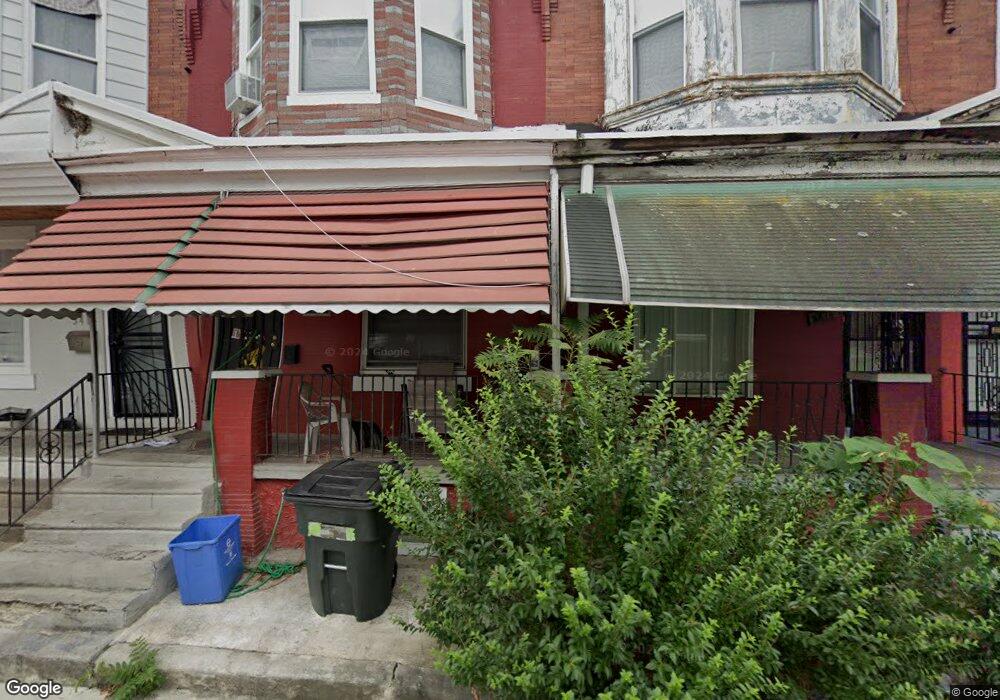
5416 Spring St Philadelphia, PA 19139
Haddington NeighborhoodEstimated Value: $96,898 - $148,000
2
Beds
1
Bath
748
Sq Ft
$157/Sq Ft
Est. Value
About This Home
This home is located at 5416 Spring St, Philadelphia, PA 19139 and is currently estimated at $117,725, approximately $157 per square foot. 5416 Spring St is a home located in Philadelphia County with nearby schools including Overbrook High School.
Ownership History
Date
Name
Owned For
Owner Type
Purchase Details
Closed on
Jun 16, 2021
Sold by
Spector Mark D and Spector Mark
Bought by
Okh Ph Owner Llc
Current Estimated Value
Purchase Details
Closed on
May 29, 2006
Sold by
Federal National Mortgage Association
Bought by
Spector Mak
Purchase Details
Closed on
Jan 30, 2006
Sold by
Maltby Sid
Bought by
Federal National Mortgage Association
Purchase Details
Closed on
Jul 27, 2000
Sold by
Yassky Steven
Bought by
Maltby Sid
Purchase Details
Closed on
Aug 26, 1999
Sold by
Oglesby Maxine and Oglesby Maxine E
Bought by
Yassky Steven
Create a Home Valuation Report for This Property
The Home Valuation Report is an in-depth analysis detailing your home's value as well as a comparison with similar homes in the area
Home Values in the Area
Average Home Value in this Area
Purchase History
| Date | Buyer | Sale Price | Title Company |
|---|---|---|---|
| Okh Ph Owner Llc | $8,075,000 | None Available | |
| Spector Mak | $28,500 | None Available | |
| Federal National Mortgage Association | $20,000 | None Available | |
| Maltby Sid | $11,000 | -- | |
| Yassky Steven | $27,000 | -- |
Source: Public Records
Tax History Compared to Growth
Tax History
| Year | Tax Paid | Tax Assessment Tax Assessment Total Assessment is a certain percentage of the fair market value that is determined by local assessors to be the total taxable value of land and additions on the property. | Land | Improvement |
|---|---|---|---|---|
| 2025 | $619 | $71,400 | $14,280 | $57,120 |
| 2024 | $619 | $71,400 | $14,280 | $57,120 |
| 2023 | $619 | $44,200 | $8,840 | $35,360 |
| 2022 | $619 | $44,200 | $8,840 | $35,360 |
| 2021 | $619 | $0 | $0 | $0 |
| 2020 | $619 | $44,200 | $6,537 | $37,663 |
| 2019 | $596 | $0 | $0 | $0 |
| 2018 | $349 | $0 | $0 | $0 |
| 2017 | $349 | $0 | $0 | $0 |
| 2016 | $349 | $0 | $0 | $0 |
| 2015 | $2,433 | $0 | $0 | $0 |
| 2014 | -- | $24,900 | $2,759 | $22,141 |
| 2012 | -- | $4,192 | $723 | $3,469 |
Source: Public Records
Map
Nearby Homes