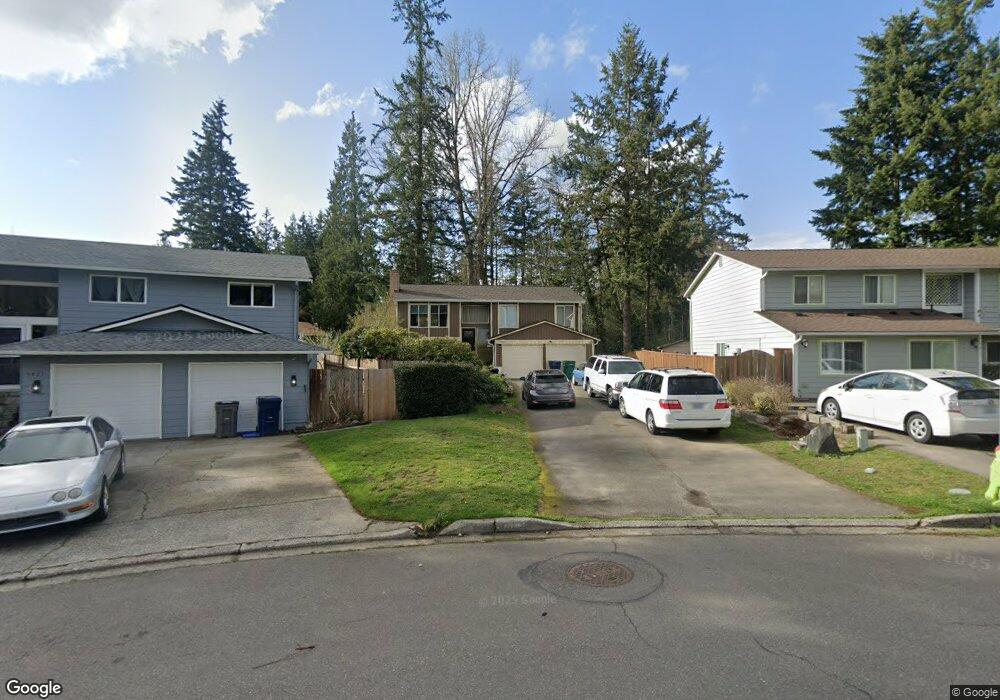
5417 144th Place SW Edmonds, WA 98026
Estimated Value: $763,963 - $855,000
3
Beds
3
Baths
840
Sq Ft
$967/Sq Ft
Est. Value
About This Home
This home is located at 5417 144th Place SW, Edmonds, WA 98026 and is currently estimated at $812,491, approximately $967 per square foot. 5417 144th Place SW is a home located in Snohomish County with nearby schools including Picnic Point Elementary School, Harbour Pointe Middle School, and Kamiak High School.
Ownership History
Date
Name
Owned For
Owner Type
Purchase Details
Closed on
May 20, 1998
Sold by
Collins Richard S and Collins Lina M
Bought by
Ferguson John L and Ferguson Rayneta
Current Estimated Value
Home Financials for this Owner
Home Financials are based on the most recent Mortgage that was taken out on this home.
Original Mortgage
$125,000
Outstanding Balance
$24,488
Interest Rate
7.13%
Estimated Equity
$788,003
Purchase Details
Closed on
Jun 15, 1995
Sold by
Migas Nancy
Bought by
Collins Richard S
Home Financials for this Owner
Home Financials are based on the most recent Mortgage that was taken out on this home.
Original Mortgage
$162,690
Interest Rate
7.92%
Mortgage Type
Assumption
Purchase Details
Closed on
Apr 5, 1995
Sold by
Ybarra Manuel A and Ybarra Kathleen A
Bought by
Migas Nancy
Create a Home Valuation Report for This Property
The Home Valuation Report is an in-depth analysis detailing your home's value as well as a comparison with similar homes in the area
Home Values in the Area
Average Home Value in this Area
Purchase History
| Date | Buyer | Sale Price | Title Company |
|---|---|---|---|
| Ferguson John L | $187,000 | -- | |
| Collins Richard S | $159,500 | Commonwealth Land Title | |
| Migas Nancy | $123,000 | -- |
Source: Public Records
Mortgage History
| Date | Status | Borrower | Loan Amount |
|---|---|---|---|
| Open | Ferguson John L | $125,000 | |
| Previous Owner | Collins Richard S | $162,690 |
Source: Public Records
Tax History Compared to Growth
Tax History
| Year | Tax Paid | Tax Assessment Tax Assessment Total Assessment is a certain percentage of the fair market value that is determined by local assessors to be the total taxable value of land and additions on the property. | Land | Improvement |
|---|---|---|---|---|
| 2025 | $5,731 | $693,900 | $465,000 | $228,900 |
| 2024 | $5,731 | $676,900 | $448,000 | $228,900 |
| 2023 | $5,497 | $677,500 | $470,000 | $207,500 |
| 2022 | $4,659 | $483,700 | $308,000 | $175,700 |
| 2020 | $4,118 | $416,800 | $262,000 | $154,800 |
| 2019 | $3,830 | $388,800 | $240,000 | $148,800 |
| 2018 | $3,809 | $337,100 | $204,000 | $133,100 |
| 2017 | $3,812 | $346,200 | $188,000 | $158,200 |
| 2016 | $3,527 | $317,700 | $166,000 | $151,700 |
| 2015 | $3,534 | $291,600 | $154,000 | $137,600 |
| 2013 | $2,932 | $225,600 | $112,000 | $113,600 |
Source: Public Records
Map
Nearby Homes
- 14714 53rd Ave W Unit 116
- 14714 53rd Ave W Unit 119
- 5015 144th St SW Unit B1
- 5015 144th St SW Unit A4
- 5015 144th St SW Unit B3
- 5015 144th St SW Unit C1
- 14019 52nd Ave W Unit B
- 5020 148th St SW Unit E1
- 14224 Beverly Park Rd Unit A
- 4726 Picnic Point Rd
- 6104 145th St SW
- 4630 143rd Place SW
- 6122 144th St SW
- 13802 60th Ave W
- 5119 136th St SW
- 6306 141st St SW
- 14913 48th Ave W Unit C-4
- 15217 48th Ave W
- 6420 141st St SW
- 15109 45th Place W
- 5411 144th Place SW
- 5421 144th Place SW
- 5505 145th St SW
- 14326 55th Ave W Unit 12
- 14332 55th Ave W Unit 13
- 5403 144th Place SW
- 14420 54th Place W
- 5404 144th Place SW
- 5509 145th St SW
- 5424 144th St SW
- 5511 145th St SW
- 5331 144th Place SW
- 14320 55th Ave W Unit 11
- 5420 144th St SW
- 14427 54th Place W
- 14323 55th Ave W Unit 10
- 14503 55th Place W
- 5416 144th St SW
- 5422 145th St SW
- 5517 145th St SW