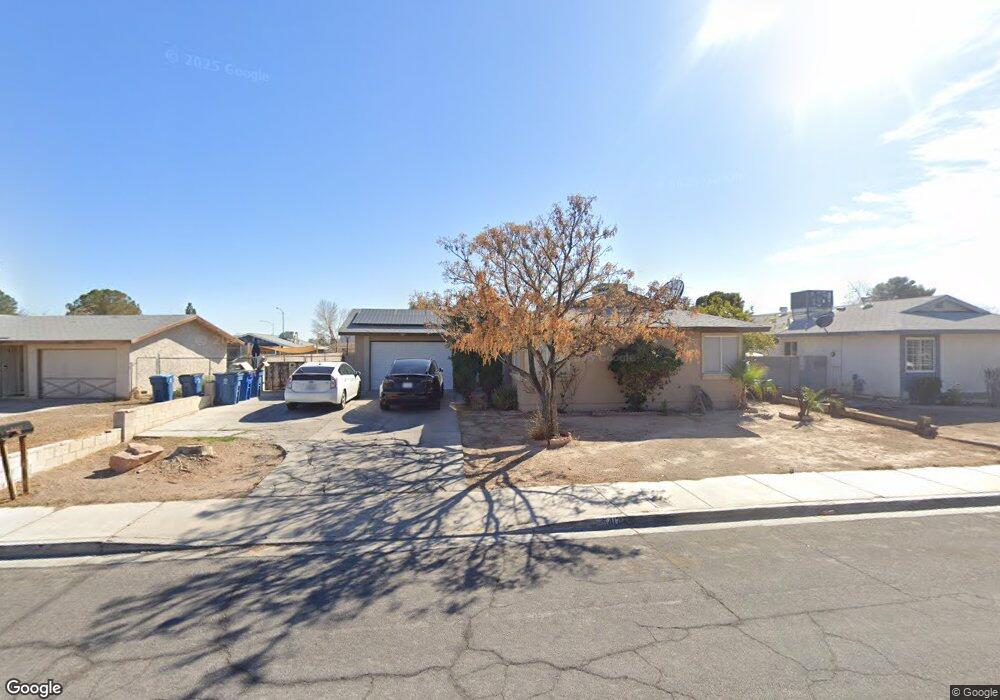
5417 Mare Way Las Vegas, NV 89108
Michael Way NeighborhoodEstimated Value: $339,541 - $427,000
3
Beds
2
Baths
1,096
Sq Ft
$346/Sq Ft
Est. Value
About This Home
This home is located at 5417 Mare Way, Las Vegas, NV 89108 and is currently estimated at $379,385, approximately $346 per square foot. 5417 Mare Way is a home located in Clark County with nearby schools including Doris M. Reed Elementary School, Irwin & Susan Molasky Junior High School, and Cimarron Memorial High School.
Ownership History
Date
Name
Owned For
Owner Type
Purchase Details
Closed on
Oct 16, 2003
Sold by
Zavalza Abel
Bought by
Zavalza Abel and Dezavalza Arcelia V Lopez
Current Estimated Value
Home Financials for this Owner
Home Financials are based on the most recent Mortgage that was taken out on this home.
Original Mortgage
$115,060
Interest Rate
6.14%
Mortgage Type
FHA
Purchase Details
Closed on
Apr 27, 1996
Sold by
Apodaca Franklin I and Apodaca Cindy E
Bought by
Zavalza Abel
Home Financials for this Owner
Home Financials are based on the most recent Mortgage that was taken out on this home.
Original Mortgage
$88,139
Interest Rate
7.84%
Mortgage Type
FHA
Purchase Details
Closed on
Apr 25, 1996
Sold by
Zavalza Arcelia V
Bought by
Zavalza Abel
Home Financials for this Owner
Home Financials are based on the most recent Mortgage that was taken out on this home.
Original Mortgage
$88,139
Interest Rate
7.84%
Mortgage Type
FHA
Create a Home Valuation Report for This Property
The Home Valuation Report is an in-depth analysis detailing your home's value as well as a comparison with similar homes in the area
Home Values in the Area
Average Home Value in this Area
Purchase History
| Date | Buyer | Sale Price | Title Company |
|---|---|---|---|
| Zavalza Abel | -- | Old Republic Title Co Of Ne | |
| Zavalza Abel | $89,000 | United Title | |
| Zavalza Abel | -- | United Title |
Source: Public Records
Mortgage History
| Date | Status | Borrower | Loan Amount |
|---|---|---|---|
| Closed | Zavalza Abel | $115,060 | |
| Closed | Zavalza Abel | $88,139 |
Source: Public Records
Tax History Compared to Growth
Tax History
| Year | Tax Paid | Tax Assessment Tax Assessment Total Assessment is a certain percentage of the fair market value that is determined by local assessors to be the total taxable value of land and additions on the property. | Land | Improvement |
|---|---|---|---|---|
| 2025 | $966 | $50,430 | $28,700 | $21,730 |
| 2024 | $895 | $50,430 | $28,700 | $21,730 |
| 2023 | $895 | $53,437 | $31,850 | $21,587 |
| 2022 | $829 | $42,831 | $22,750 | $20,081 |
| 2021 | $768 | $38,747 | $19,250 | $19,497 |
| 2020 | $710 | $38,245 | $18,550 | $19,695 |
| 2019 | $665 | $35,494 | $15,750 | $19,744 |
| 2018 | $635 | $34,320 | $15,050 | $19,270 |
| 2017 | $1,016 | $30,991 | $11,200 | $19,791 |
| 2016 | $596 | $28,478 | $8,050 | $20,428 |
| 2015 | $593 | $26,236 | $7,000 | $19,236 |
| 2014 | $576 | $23,032 | $5,250 | $17,782 |
Source: Public Records
Map
Nearby Homes
- 5325 Redberry St
- 5500 Avenida Vaquero
- 5305 W Cheyenne Ave
- 2913 N Michael Way
- 3217 Joann Way
- 2829 N Michael Way
- 0 W Cheyenne Ave
- 5905 Paseo Montana
- 5710 Madre Mesa Dr
- 5828 Divers Cove Way
- 5901 Oceanside Way
- 2879 N Jones Blvd
- 5008 Donnie Ave
- 3500 N Rancho Dr
- 5486 Alfred Dr
- 5807 Madre Mesa Dr
- 6100 W Brooks Ave
- 5854 Alfred Dr
- 5113 Mambo Vista Ave
- 5537 Cleary Ct
- 5421 Mare Way
- 5413 Mare Way
- 5416 Burntwood Way
- 5420 Burntwood Way
- 5501 Mare Way
- 5412 Burntwood Way
- 5409 Mare Way
- 5500 Burntwood Way
- 5420 Mare Way
- 5416 Mare Way
- 5500 Mare Way
- 5505 Mare Way
- 5412 Mare Way
- 5504 Burntwood Way
- 5408 Burntwood Way
- 5405 Mare Way
- 5504 Mare Way
- 5408 Mare Way
- 5509 Mare Way
- 5417 Burntwood Way