Estimated Value: $432,794 - $475,000
4
Beds
2
Baths
1,766
Sq Ft
$256/Sq Ft
Est. Value
About This Home
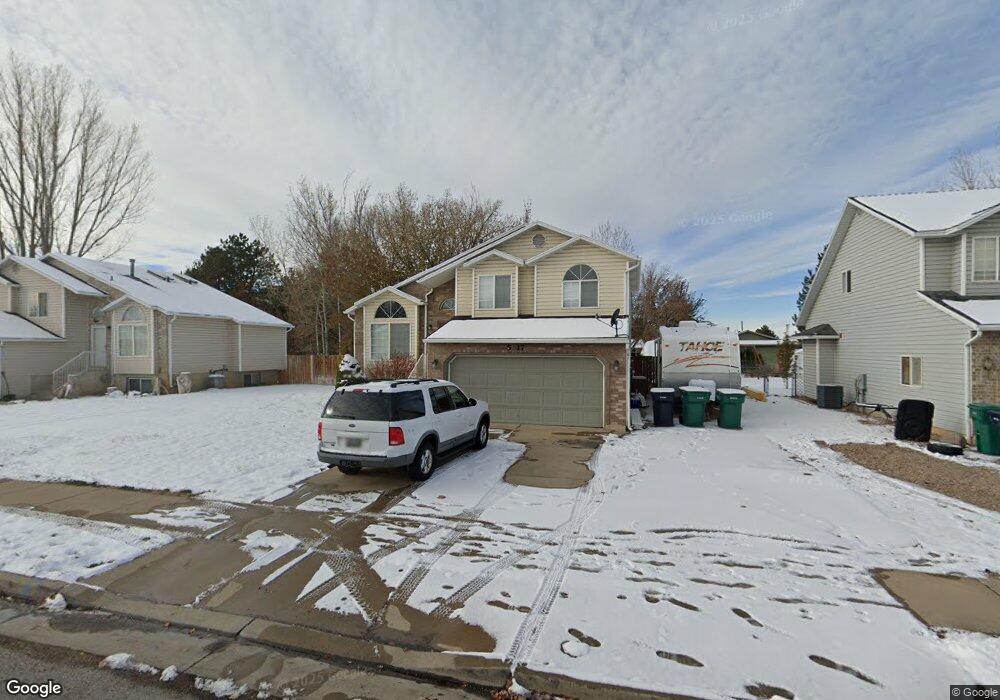
This home is located at 5417 S 3400 W, Roy, UT 84067 and is currently estimated at $452,199, approximately $256 per square foot. 5417 S 3400 W is a home located in Weber County with nearby schools including Roy Elementary School, Roy Junior High School, and Roy High School.
Ownership History
Date
Name
Owned For
Owner Type
Purchase Details
Closed on
Mar 19, 2013
Sold by
Skiver Glen J and Parker Jennifer L
Bought by
American Homes 4 Rent Properties Three L
Current Estimated Value
Purchase Details
Closed on
Nov 8, 2000
Sold by
Lefler James W
Bought by
Skiver Glen J and Parker Jennifer L
Home Financials for this Owner
Home Financials are based on the most recent Mortgage that was taken out on this home.
Original Mortgage
$131,416
Interest Rate
7.88%
Purchase Details
Closed on
Apr 29, 1996
Sold by
Layton Marie D and Turner Marie D
Bought by
Lefler James W
Home Financials for this Owner
Home Financials are based on the most recent Mortgage that was taken out on this home.
Original Mortgage
$99,500
Interest Rate
7.84%
Create a Home Valuation Report for This Property
The Home Valuation Report is an in-depth analysis detailing your home's value as well as a comparison with similar homes in the area
Home Values in the Area
Average Home Value in this Area
Purchase History
| Date | Buyer | Sale Price | Title Company |
|---|---|---|---|
| American Homes 4 Rent Properties Three L | -- | Inwest Title Services Inc | |
| Skiver Glen J | -- | Associated Title | |
| Lefler James W | -- | First American Title |
Source: Public Records
Mortgage History
| Date | Status | Borrower | Loan Amount |
|---|---|---|---|
| Previous Owner | Skiver Glen J | $131,416 | |
| Previous Owner | Lefler James W | $99,500 |
Source: Public Records
Tax History Compared to Growth
Tax History
| Year | Tax Paid | Tax Assessment Tax Assessment Total Assessment is a certain percentage of the fair market value that is determined by local assessors to be the total taxable value of land and additions on the property. | Land | Improvement |
|---|---|---|---|---|
| 2025 | $2,647 | $418,945 | $134,215 | $284,730 |
| 2024 | $2,584 | $412,000 | $134,215 | $277,785 |
| 2023 | $2,549 | $408,000 | $133,001 | $274,999 |
| 2022 | $2,525 | $415,000 | $117,411 | $297,589 |
| 2021 | $2,168 | $323,000 | $86,885 | $236,115 |
| 2020 | $1,980 | $270,000 | $86,885 | $183,115 |
| 2019 | $1,965 | $253,000 | $51,472 | $201,528 |
| 2018 | $1,933 | $235,000 | $47,405 | $187,595 |
| 2017 | $1,780 | $202,000 | $47,405 | $154,595 |
| 2016 | $1,642 | $99,641 | $26,078 | $73,563 |
| 2015 | $1,442 | $88,747 | $23,295 | $65,452 |
| 2014 | $1,374 | $83,097 | $23,295 | $59,802 |
Source: Public Records
Map
Nearby Homes
- 5578 S 3450 W
- 3607 W 5400 S
- 3443 W 5200 S Unit 2&3
- 5432 S 3150 W
- 5321 S 3100 W
- 5538 S 3150 W
- 3186 W 5625 S
- 3176 W 5625 S
- 3166 W 5625 S
- 3766 W 5300 S
- 5791 S 3260 W
- 5859 S 3500 W
- 4964 S 3375 W
- 3809 W 5625 S
- 3832 W 5625 S
- 3509 W 4835 S Unit 26
- 3826 W 5750 S
- 3780 W 5850 S
- 3523 W 4835 S Unit 28
- 3524 W 4835 S Unit 22