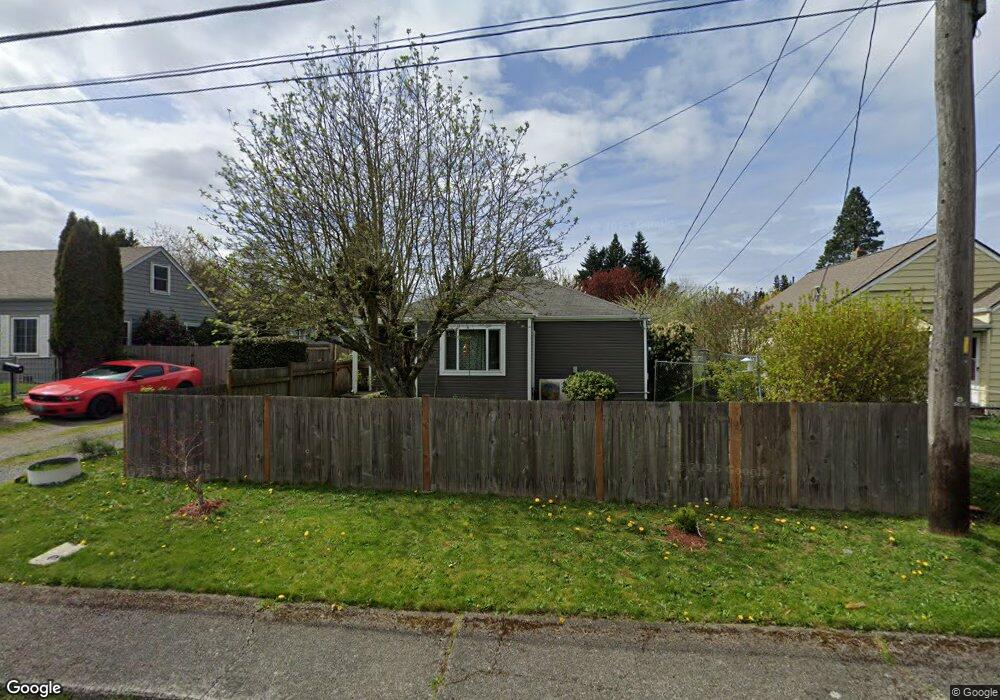
5418 E C St Tacoma, WA 98404
Eastside NeighborhoodEstimated Value: $377,000 - $398,000
2
Beds
1
Bath
1,038
Sq Ft
$373/Sq Ft
Est. Value
About This Home
This home is located at 5418 E C St, Tacoma, WA 98404 and is currently estimated at $387,471, approximately $373 per square foot. 5418 E C St is a home located in Pierce County with nearby schools including Oakland High School, Hunt Middle School, and Lincoln High School.
Ownership History
Date
Name
Owned For
Owner Type
Purchase Details
Closed on
Oct 21, 2019
Sold by
Smith Arnold and Smith Kyenae
Bought by
Chappelle Jessica Smith
Current Estimated Value
Purchase Details
Closed on
Sep 13, 2006
Sold by
Wheeler James E
Bought by
Smith Arnold K and Smith Kyenae
Home Financials for this Owner
Home Financials are based on the most recent Mortgage that was taken out on this home.
Original Mortgage
$130,000
Interest Rate
6.56%
Mortgage Type
Purchase Money Mortgage
Create a Home Valuation Report for This Property
The Home Valuation Report is an in-depth analysis detailing your home's value as well as a comparison with similar homes in the area
Home Values in the Area
Average Home Value in this Area
Purchase History
| Date | Buyer | Sale Price | Title Company |
|---|---|---|---|
| Chappelle Jessica Smith | -- | None Available | |
| Smith Arnold K | $175,000 | None Available |
Source: Public Records
Mortgage History
| Date | Status | Borrower | Loan Amount |
|---|---|---|---|
| Previous Owner | Smith Arnold K | $130,000 |
Source: Public Records
Tax History
| Year | Tax Paid | Tax Assessment Tax Assessment Total Assessment is a certain percentage of the fair market value that is determined by local assessors to be the total taxable value of land and additions on the property. | Land | Improvement |
|---|---|---|---|---|
| 2025 | $3,731 | $366,400 | $188,300 | $178,100 |
| 2024 | $3,731 | $353,700 | $177,900 | $175,800 |
| 2023 | $3,731 | $334,900 | $169,100 | $165,800 |
| 2022 | $3,488 | $358,900 | $176,100 | $182,800 |
| 2021 | $3,119 | $247,900 | $104,800 | $143,100 |
| 2019 | $2,577 | $223,100 | $87,600 | $135,500 |
| 2018 | $2,712 | $198,000 | $70,400 | $127,600 |
| 2017 | $2,398 | $171,500 | $58,700 | $112,800 |
| 2016 | $2,057 | $127,300 | $43,400 | $83,900 |
| 2014 | $1,815 | $118,200 | $42,900 | $75,300 |
| 2013 | $1,815 | $107,400 | $37,600 | $69,800 |
Source: Public Records
Map
Nearby Homes
Your Personal Tour Guide
Ask me questions while you tour the home.