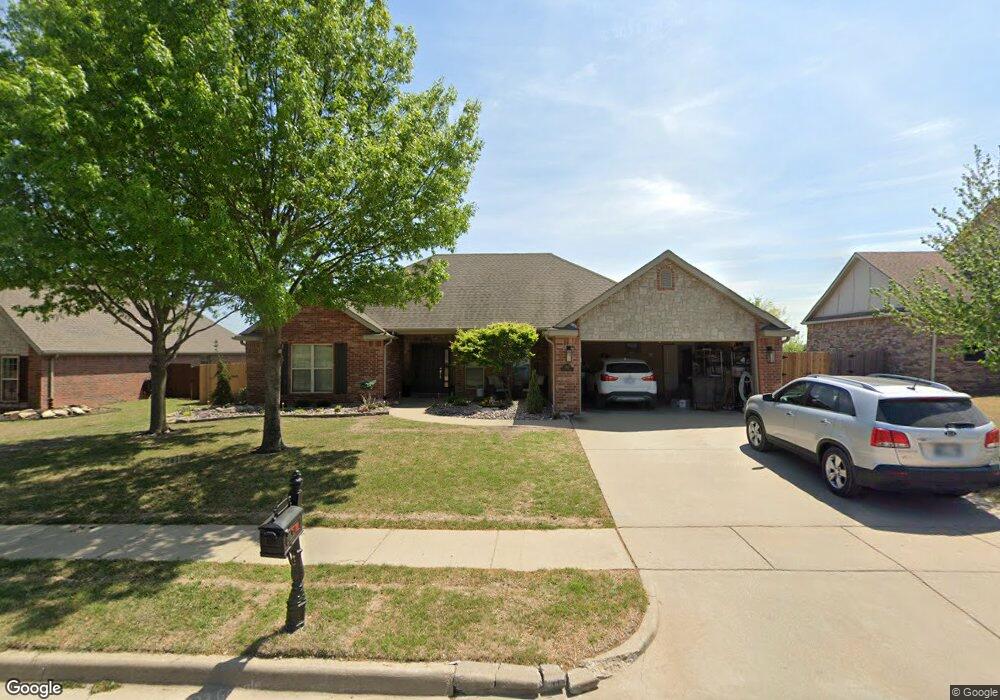
5419 Cooper Ct Bartlesville, OK 74006
Estimated Value: $294,377 - $319,000
4
Beds
2
Baths
2,000
Sq Ft
$156/Sq Ft
Est. Value
About This Home
This home is located at 5419 Cooper Ct, Bartlesville, OK 74006 and is currently estimated at $311,094, approximately $155 per square foot. 5419 Cooper Ct is a home located in Washington County with nearby schools including Wayside Elementary School, Central Middle School, and Bartlesville High School.
Ownership History
Date
Name
Owned For
Owner Type
Purchase Details
Closed on
Jun 22, 2011
Sold by
Barnes Lawrence Lloyd and Barnes Rita Kathleen
Bought by
Lynn Jim and Lynn Sherri
Current Estimated Value
Home Financials for this Owner
Home Financials are based on the most recent Mortgage that was taken out on this home.
Original Mortgage
$154,000
Outstanding Balance
$9,385
Interest Rate
4.7%
Mortgage Type
New Conventional
Estimated Equity
$301,709
Purchase Details
Closed on
Sep 15, 2008
Sold by
Homestead Home Llc
Bought by
Barnes Lawrence Lloyd and Barnes Rita Kathleen
Home Financials for this Owner
Home Financials are based on the most recent Mortgage that was taken out on this home.
Original Mortgage
$69,575
Interest Rate
6.6%
Mortgage Type
New Conventional
Create a Home Valuation Report for This Property
The Home Valuation Report is an in-depth analysis detailing your home's value as well as a comparison with similar homes in the area
Home Values in the Area
Average Home Value in this Area
Purchase History
| Date | Buyer | Sale Price | Title Company |
|---|---|---|---|
| Lynn Jim | $192,500 | None Available | |
| Barnes Lawrence Lloyd | $200,000 | None Available |
Source: Public Records
Mortgage History
| Date | Status | Borrower | Loan Amount |
|---|---|---|---|
| Open | Lynn Jim | $154,000 | |
| Previous Owner | Barnes Lawrence Lloyd | $69,575 |
Source: Public Records
Tax History Compared to Growth
Tax History
| Year | Tax Paid | Tax Assessment Tax Assessment Total Assessment is a certain percentage of the fair market value that is determined by local assessors to be the total taxable value of land and additions on the property. | Land | Improvement |
|---|---|---|---|---|
| 2025 | $2,648 | $23,741 | $3,600 | $20,141 |
| 2024 | $2,648 | $23,050 | $4,200 | $18,850 |
| 2023 | $2,648 | $23,050 | $4,200 | $18,850 |
| 2022 | $2,641 | $23,050 | $4,200 | $18,850 |
| 2021 | $2,590 | $23,050 | $4,200 | $18,850 |
| 2020 | $2,648 | $23,050 | $4,200 | $18,850 |
| 2019 | $2,649 | $23,050 | $4,200 | $18,850 |
| 2018 | $2,755 | $23,050 | $4,200 | $18,850 |
| 2017 | $2,819 | $23,050 | $4,200 | $18,850 |
| 2016 | $2,656 | $23,130 | $4,200 | $18,930 |
| 2015 | $2,687 | $23,130 | $4,200 | $18,930 |
| 2014 | $2,721 | $23,130 | $4,200 | $18,930 |
Source: Public Records
Map
Nearby Homes
- 5526 Nottingham Place
- 5514 Ashbrook Dr
- 5711 Nottingham Place
- 5710 Nottingham Place
- 2112 SE Lester
- 5300 Charleston Dr
- 5205 Charleston Dr
- 4105 Starboard Ct
- 1 Barnett Ave
- 2 Barnett Ave
- 2104 SE Lester
- 5301 Barnett Ave
- 5205 Barnett Ave
- 1920 Richmond Dr
- 1912 Lester Ave
- 1935 Putnam Dr
- 4821 SE Barlow Dr
- 2105 Lester Ave
- 2109 Lester Ave
- 1928 Lester Ave
- 5423 Cooper Ct
- 5415 Cooper Ct
- 5414 Cooper Ct
- 5427 Cooper Ct
- 5411 Cooper Ct
- 5418 Cooper Ct
- 5410 Cooper Ct
- 5422 Cooper Ct
- 5406 Cooper Ct
- 5507 Cooper Ct
- 5407 Cooper Ct
- 5415 Nottingham Place
- 5506 Cooper Ct
- 5419 Nottingham Place
- 5411 Nottingham Place
- 5423 Nottingham Place
- 5402 Cooper Ct
- 5511 Cooper Ct
- 5407 Nottingham Place
- 5403 Cooper Ct