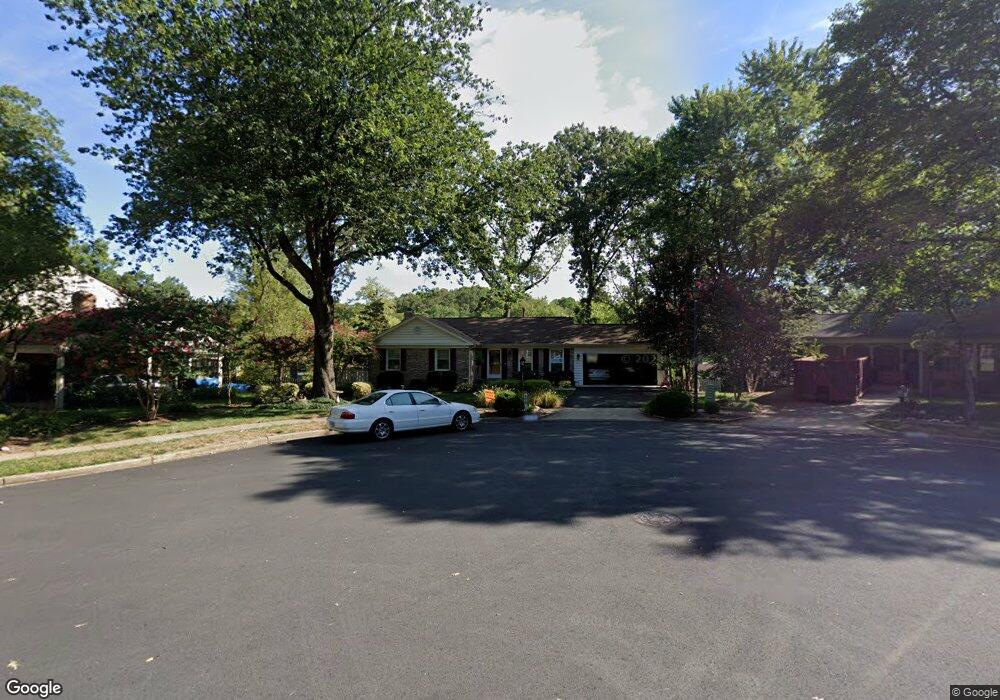
5419 Rumsey Place Fairfax, VA 22032
Estimated Value: $795,936 - $864,000
5
Beds
3
Baths
1,522
Sq Ft
$549/Sq Ft
Est. Value
About This Home
This home is located at 5419 Rumsey Place, Fairfax, VA 22032 and is currently estimated at $835,484, approximately $548 per square foot. 5419 Rumsey Place is a home located in Fairfax County with nearby schools including Bonnie Brae Elementary School, James W Robinson, Jr. Secondary School, and Trinity Christian School.
Ownership History
Date
Name
Owned For
Owner Type
Purchase Details
Closed on
Feb 25, 2019
Sold by
Simmons Paul and Simmons Pauline
Bought by
Simmons Paul and Simmons Pauline
Current Estimated Value
Purchase Details
Closed on
May 10, 2001
Sold by
Miller Gregory
Bought by
Simmons Paul K
Home Financials for this Owner
Home Financials are based on the most recent Mortgage that was taken out on this home.
Original Mortgage
$270,000
Outstanding Balance
$99,698
Interest Rate
6.88%
Estimated Equity
$735,786
Purchase Details
Closed on
Sep 29, 1993
Sold by
Natoli D L
Bought by
Miller Gregory
Home Financials for this Owner
Home Financials are based on the most recent Mortgage that was taken out on this home.
Original Mortgage
$184,000
Interest Rate
7%
Create a Home Valuation Report for This Property
The Home Valuation Report is an in-depth analysis detailing your home's value as well as a comparison with similar homes in the area
Home Values in the Area
Average Home Value in this Area
Purchase History
| Date | Buyer | Sale Price | Title Company |
|---|---|---|---|
| Simmons Paul | -- | None Available | |
| Simmons Paul K | $300,000 | -- | |
| Miller Gregory | $216,660 | -- |
Source: Public Records
Mortgage History
| Date | Status | Borrower | Loan Amount |
|---|---|---|---|
| Open | Simmons Paul K | $270,000 | |
| Previous Owner | Miller Gregory | $184,000 |
Source: Public Records
Tax History Compared to Growth
Tax History
| Year | Tax Paid | Tax Assessment Tax Assessment Total Assessment is a certain percentage of the fair market value that is determined by local assessors to be the total taxable value of land and additions on the property. | Land | Improvement |
|---|---|---|---|---|
| 2025 | $8,298 | $748,900 | $295,000 | $453,900 |
| 2024 | $8,298 | $716,250 | $280,000 | $436,250 |
| 2023 | $8,210 | $727,510 | $280,000 | $447,510 |
| 2022 | $7,677 | $671,370 | $255,000 | $416,370 |
| 2021 | $7,284 | $620,700 | $235,000 | $385,700 |
| 2020 | $6,938 | $586,190 | $230,000 | $356,190 |
| 2019 | $6,819 | $576,190 | $220,000 | $356,190 |
| 2018 | $6,374 | $554,260 | $210,000 | $344,260 |
| 2017 | $6,422 | $553,120 | $210,000 | $343,120 |
| 2016 | $6,038 | $521,150 | $200,000 | $321,150 |
| 2015 | $5,816 | $521,150 | $200,000 | $321,150 |
| 2014 | $5,563 | $499,610 | $200,000 | $299,610 |
Source: Public Records
Map
Nearby Homes
- 10919 Spurlock Ct
- 5538 Shooters Hill Ln
- 0 Joshua Davis Ct
- 10708 Rippon Lodge Dr
- 11123 Popes Head Rd
- 11102 Fairfax Station Rd
- 10710 Almond St
- 5503 Fireside Ct
- 5703 Oak Stake Ct
- 10402 Hollyoak Place
- 5674 Oak Tanager Ct
- 10412 Pearl St
- 10434 Calumet Grove Dr
- 5900 Carters Oak Ct
- 5602 Summer Oak Way
- 11433 Popes Head Rd
- 5453 Cheshire Meadows Way
- 11415 Fairfax Station Rd
- 5806 Cove Landing Rd Unit 304
- 5902 Cove Landing Rd Unit 202
- 5415 Rumsey Place
- 5421 Rumsey Place
- 10907 Paynes Church Dr
- 10909 Paynes Church Dr
- 10905 Paynes Church Dr
- 10911 Paynes Church Dr
- 10903 Paynes Church Dr
- 5418 Rumsey Place
- 5420 Rumsey Place
- 5412 Governor Yeardley Dr
- 5416 Rumsey Place
- 5414 Rumsey Place
- 10901 Paynes Church Dr
- 5414 Governor Yeardley Dr
- 5412 Rumsey Place
- 10908 Paynes Church Dr
- 5410 Ellzey Dr
- 10915 Paynes Church Dr
- 5408 Quincy Marr Dr
- 10908 Spurlock Ct