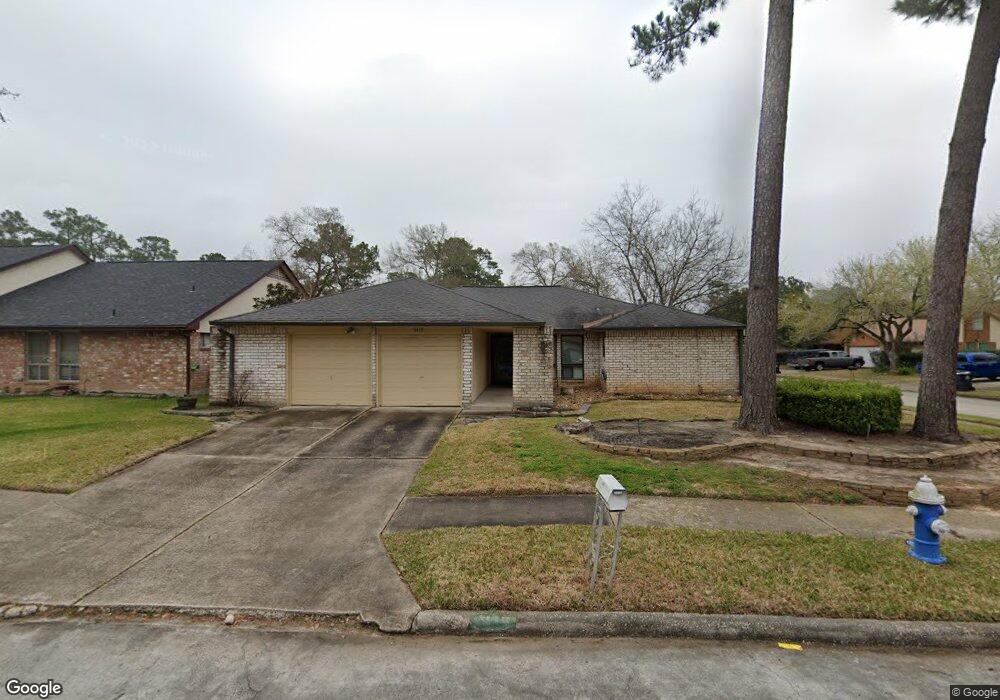
5419 Sweetwind Ln Spring, TX 77373
Estimated Value: $215,000 - $237,000
3
Beds
2
Baths
1,708
Sq Ft
$129/Sq Ft
Est. Value
About This Home
This home is located at 5419 Sweetwind Ln, Spring, TX 77373 and is currently estimated at $220,776, approximately $129 per square foot. 5419 Sweetwind Ln is a home located in Harris County with nearby schools including Chet Burchett Elementary School, Dueitt Middle School, and Spring High School.
Ownership History
Date
Name
Owned For
Owner Type
Purchase Details
Closed on
Oct 20, 2014
Sold by
Monge Jose Fernando and Monge Esmeralda S
Bought by
Solarin Musibau O
Current Estimated Value
Home Financials for this Owner
Home Financials are based on the most recent Mortgage that was taken out on this home.
Original Mortgage
$80,000
Outstanding Balance
$26,914
Interest Rate
4.16%
Mortgage Type
New Conventional
Estimated Equity
$193,862
Purchase Details
Closed on
Mar 13, 2003
Sold by
Cookus Louise M
Bought by
Monge Jose Fernando
Home Financials for this Owner
Home Financials are based on the most recent Mortgage that was taken out on this home.
Original Mortgage
$88,202
Interest Rate
5.83%
Mortgage Type
FHA
Purchase Details
Closed on
Jun 29, 2000
Sold by
Cookus Louise M
Bought by
Cookus Family Trust
Create a Home Valuation Report for This Property
The Home Valuation Report is an in-depth analysis detailing your home's value as well as a comparison with similar homes in the area
Home Values in the Area
Average Home Value in this Area
Purchase History
| Date | Buyer | Sale Price | Title Company |
|---|---|---|---|
| Solarin Musibau O | -- | None Available | |
| Monge Jose Fernando | -- | Alamo Title Company | |
| Cookus Family Trust | -- | -- |
Source: Public Records
Mortgage History
| Date | Status | Borrower | Loan Amount |
|---|---|---|---|
| Open | Solarin Musibau O | $80,000 | |
| Previous Owner | Monge Jose Fernando | $88,202 |
Source: Public Records
Tax History Compared to Growth
Tax History
| Year | Tax Paid | Tax Assessment Tax Assessment Total Assessment is a certain percentage of the fair market value that is determined by local assessors to be the total taxable value of land and additions on the property. | Land | Improvement |
|---|---|---|---|---|
| 2025 | $637 | $224,861 | $52,091 | $172,770 |
| 2024 | $637 | $174,542 | $52,091 | $122,451 |
| 2023 | $637 | $216,322 | $52,091 | $164,231 |
| 2022 | $3,946 | $191,488 | $36,590 | $154,898 |
| 2021 | $3,772 | $151,299 | $15,246 | $136,053 |
| 2020 | $3,551 | $132,554 | $15,246 | $117,308 |
| 2019 | $3,802 | $140,335 | $15,246 | $125,089 |
| 2018 | $3,156 | $129,507 | $15,246 | $114,261 |
| 2017 | $3,434 | $129,507 | $15,246 | $114,261 |
| 2016 | $3,122 | $113,410 | $15,246 | $98,164 |
| 2015 | $2,495 | $106,702 | $15,246 | $91,456 |
| 2014 | $2,495 | $87,555 | $15,246 | $72,309 |
Source: Public Records
Map
Nearby Homes
- 5414 Sweetwind Ln
- 5311 Sweetwind Ln
- 23206 Goodfellow Dr
- 5410 Dibello Forest Ln
- 23114 Goodfellow Dr
- 5031 Monteith Dr
- 4307 Wyanngate Dr
- 23338 Goodfellow Dr
- 5027 Monteith Dr
- 5311 Oaklynn Dr
- 5527 Broad Spruce St
- 4314 Wyanngate Dr
- 23103 Calico Corners Ln
- 5015 Monteith Dr
- 5023 Glendower Dr
- 23431 Wrexham St
- 5002 Maurita Dr
- 23022 Laketree Ln
- 23546 Wrexham St
- 23407 Little Wind Ln
- 5415 Sweetwind Ln
- 5438 Mossgrey Ln
- 5434 Mossgrey Ln
- 5411 Sweetwind Ln
- 5418 Sweetwind Ln
- 5406 Monteith Dr
- 5430 Mossgrey Ln
- 5314 Monteith Dr
- 5410 Monteith Dr
- 5407 Sweetwind Ln
- 5410 Sweetwind Ln
- 5426 Mossgrey Ln
- 5414 Monteith Dr
- 5402 Sweetwind Ln
- 5306 Monteith Dr
- 5403 Sweetwind Ln
- 5407 Rushstone Ln
- 23302 Calico Corners Ln
- 5403 Rushstone Ln
- 5411 Rushstone Ln