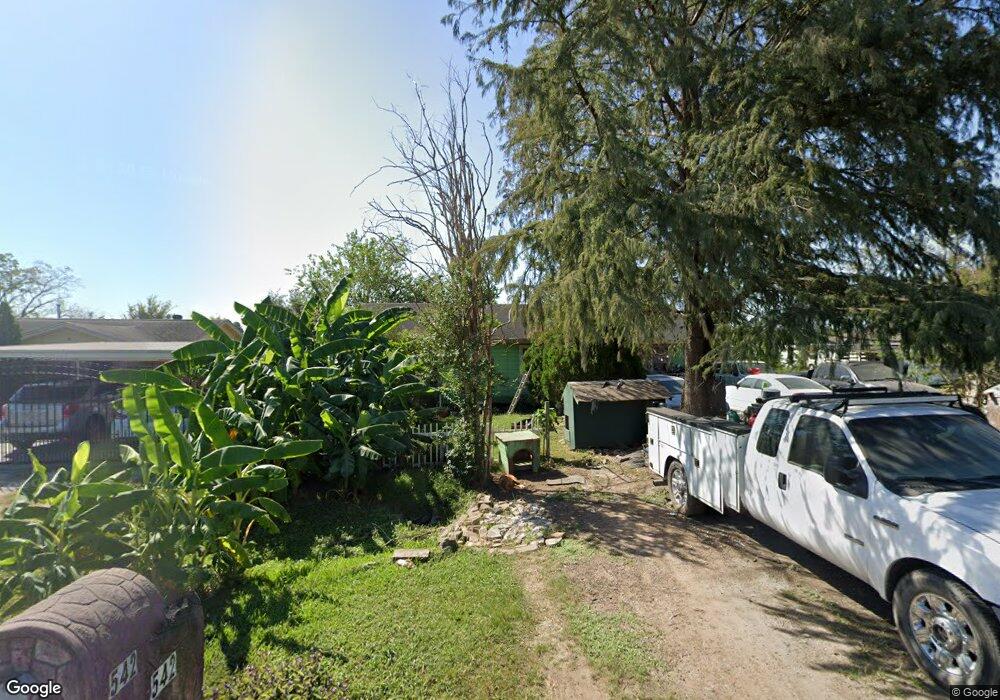
542 Buschong St Houston, TX 77060
Estimated Value: $203,864 - $248,000
3
Beds
1
Bath
1,367
Sq Ft
$162/Sq Ft
Est. Value
About This Home
This home is located at 542 Buschong St, Houston, TX 77060 and is currently estimated at $221,216, approximately $161 per square foot. 542 Buschong St is a home located in Harris County with nearby schools including Hinojosa EC/PK/K, Odom Elementary School, and Aldine Middle School.
Ownership History
Date
Name
Owned For
Owner Type
Purchase Details
Closed on
Feb 22, 2010
Sold by
Martinez Juan
Bought by
Madrid Marcos
Current Estimated Value
Home Financials for this Owner
Home Financials are based on the most recent Mortgage that was taken out on this home.
Original Mortgage
$87,875
Outstanding Balance
$58,391
Interest Rate
5.11%
Mortgage Type
Purchase Money Mortgage
Estimated Equity
$162,825
Purchase Details
Closed on
Aug 15, 2002
Sold by
Wendt John R and Wendt Yvonne L
Bought by
Martinez Juan
Home Financials for this Owner
Home Financials are based on the most recent Mortgage that was taken out on this home.
Original Mortgage
$87,875
Interest Rate
6.48%
Mortgage Type
Stand Alone First
Purchase Details
Closed on
Apr 22, 1999
Sold by
Kittle Shirley Ann Robuck
Bought by
Wendt John R and Wendt Yvonne L
Create a Home Valuation Report for This Property
The Home Valuation Report is an in-depth analysis detailing your home's value as well as a comparison with similar homes in the area
Home Values in the Area
Average Home Value in this Area
Purchase History
| Date | Buyer | Sale Price | Title Company |
|---|---|---|---|
| Madrid Marcos | -- | None Available | |
| Martinez Juan | -- | American Title Co | |
| Wendt John R | -- | -- |
Source: Public Records
Mortgage History
| Date | Status | Borrower | Loan Amount |
|---|---|---|---|
| Open | Madrid Marcos | $87,875 | |
| Previous Owner | Martinez Juan | $87,875 |
Source: Public Records
Tax History Compared to Growth
Tax History
| Year | Tax Paid | Tax Assessment Tax Assessment Total Assessment is a certain percentage of the fair market value that is determined by local assessors to be the total taxable value of land and additions on the property. | Land | Improvement |
|---|---|---|---|---|
| 2025 | $1,563 | $181,582 | $44,616 | $136,966 |
| 2024 | $1,563 | $217,746 | $44,616 | $173,130 |
| 2023 | $1,563 | $221,273 | $44,616 | $176,657 |
| 2022 | $2,435 | $142,554 | $27,885 | $114,669 |
| 2021 | $2,328 | $135,461 | $27,885 | $107,576 |
| 2020 | $2,233 | $114,036 | $22,308 | $91,728 |
| 2019 | $2,126 | $0 | $0 | $0 |
| 2018 | $924 | $89,375 | $22,308 | $67,067 |
| 2017 | $1,935 | $89,375 | $22,308 | $67,067 |
| 2016 | $1,759 | $77,604 | $16,731 | $60,873 |
| 2015 | $1,178 | $72,506 | $16,731 | $55,775 |
| 2014 | $1,178 | $65,439 | $16,731 | $48,708 |
Source: Public Records
Map
Nearby Homes
- 14811 W Hardy Rd
- 14929 Henry Rd
- 347 Saddle Horn Dr
- 15035 Lillja Rd
- 15114 Kaler Rd
- 15123 Kaler Rd
- 15150 Dogwood Tree St
- 15806 Sulky Trail Ct
- 251 Goodson Dr
- 307 Sulky Trail St
- 611 Glenvale Dr
- 522 Hollyvale Dr
- 15002 Imperial Valley Dr
- 715 Branding Iron Ln
- 631 Branding Iron Ln
- 1114 Blackwood Ave
- 530 Branding Iron Ln
- 710 Ridgeland Ct
- 231 San Fernando Dr
- 129 Casa Grande Dr Unit 129
- 550 Buschong St
- 15628 Sellers Rd
- 558 Buschong St
- 602 Bushong St
- 15710 Sellers Rd
- 602 Buschong St
- 626 Buschong St
- 616 Buffington St
- 627 Buschong St
- 15504 Sellers Rd Unit 5
- 15504 Sellers Rd
- 620 Buffington St
- 647 Kaylyn St
- 624 Buffington St
- 628 Buffington St
- 626 Buffington St
- 626 1/2 Buffington St
- 643 Kaylyn St
- 15503 Sellers Rd
- 750 Buschong St