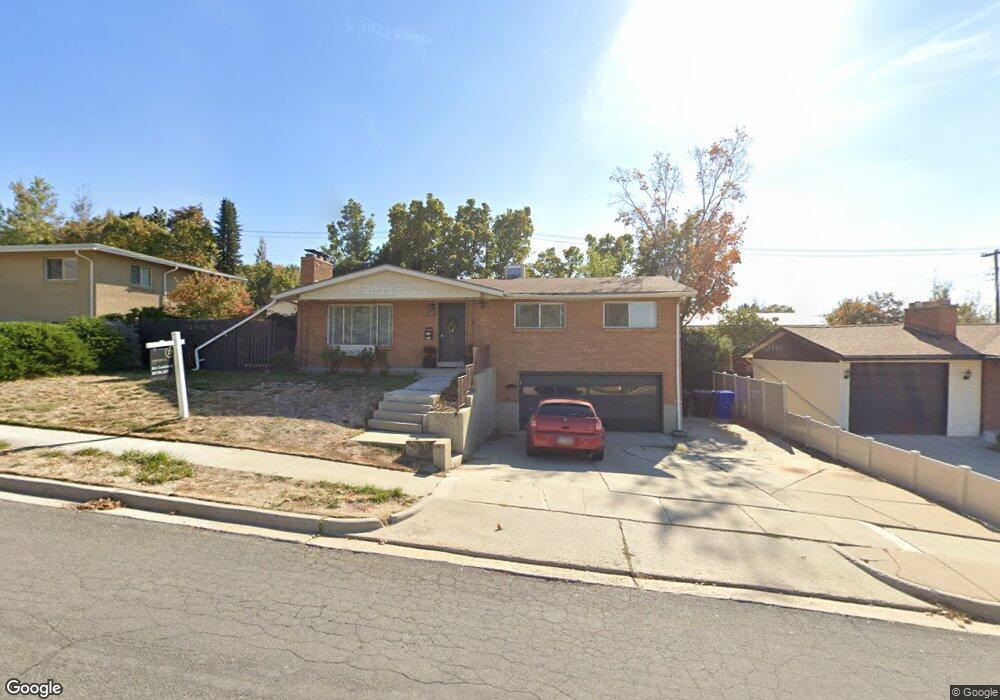
542 E 1650 S Bountiful, UT 84010
Estimated Value: $479,000 - $536,000
4
Beds
2
Baths
1,856
Sq Ft
$270/Sq Ft
Est. Value
About This Home
This home is located at 542 E 1650 S, Bountiful, UT 84010 and is currently estimated at $500,762, approximately $269 per square foot. 542 E 1650 S is a home located in Davis County with nearby schools including Valley View School, Mueller Park Junior High School, and Bountiful High School.
Ownership History
Date
Name
Owned For
Owner Type
Purchase Details
Closed on
Jan 16, 2024
Sold by
Kinion Patricia M and Wentland Candace
Bought by
Candace Rae Wentland Living Trust and Wentland
Current Estimated Value
Purchase Details
Closed on
Jul 28, 2023
Sold by
Florence Holder Trust
Bought by
Kinion Patricia M and Wentland Candace
Home Financials for this Owner
Home Financials are based on the most recent Mortgage that was taken out on this home.
Original Mortgage
$145,000
Interest Rate
6.69%
Mortgage Type
New Conventional
Purchase Details
Closed on
Jul 20, 1999
Sold by
Holder Florence L
Bought by
Holder Florence L and The Florence L Holder Trust
Create a Home Valuation Report for This Property
The Home Valuation Report is an in-depth analysis detailing your home's value as well as a comparison with similar homes in the area
Purchase History
| Date | Buyer | Sale Price | Title Company |
|---|---|---|---|
| Candace Rae Wentland Living Trust | -- | None Listed On Document | |
| Kinion Patricia M | -- | Title Guarantee | |
| Holder Florence L | -- | -- |
Source: Public Records
Mortgage History
| Date | Status | Borrower | Loan Amount |
|---|---|---|---|
| Previous Owner | Kinion Patricia M | $145,000 |
Source: Public Records
Tax History
| Year | Tax Paid | Tax Assessment Tax Assessment Total Assessment is a certain percentage of the fair market value that is determined by local assessors to be the total taxable value of land and additions on the property. | Land | Improvement |
|---|---|---|---|---|
| 2025 | $2,788 | $253,550 | $124,909 | $128,641 |
| 2024 | $2,597 | $245,300 | $109,495 | $135,805 |
| 2023 | $2,476 | $233,200 | $111,895 | $121,304 |
| 2022 | $2,526 | $421,000 | $202,972 | $218,028 |
| 2021 | $2,325 | $321,000 | $146,014 | $174,986 |
| 2020 | $2,239 | $285,000 | $125,358 | $159,642 |
| 2019 | $2,172 | $281,000 | $136,752 | $144,248 |
| 2018 | $1,945 | $253,000 | $134,150 | $118,850 |
| 2016 | $1,580 | $117,865 | $45,349 | $72,516 |
| 2015 | $1,598 | $108,625 | $45,349 | $63,276 |
| 2014 | $1,719 | $121,415 | $45,349 | $76,066 |
| 2013 | -- | $113,022 | $50,459 | $62,563 |
Source: Public Records
Map
Nearby Homes
- 631 E 1700 S
- 1761 S Davis Blvd
- 380 E 1500 S
- 1886 S Jeri Dr
- 288 E 1650 S
- 795 Abby Ln Unit 5
- 775 E 1500 S
- 2059 S 350 E Unit 6
- 141 E 1650 S
- 2038 S 350 E Unit 3
- 295 E 2050 S Unit 1
- 2053 S 350 E Unit 7
- 2046 S 350 E Unit 4
- 861 E Millbrook Way
- 296 E 2050 S Unit 2
- 285 E 1100 S
- 320 E 2100 S
- 188 E 2050 S Unit D3
- 994 Deborah Dr
- 1087 Arlington Way
Your Personal Tour Guide
Ask me questions while you tour the home.