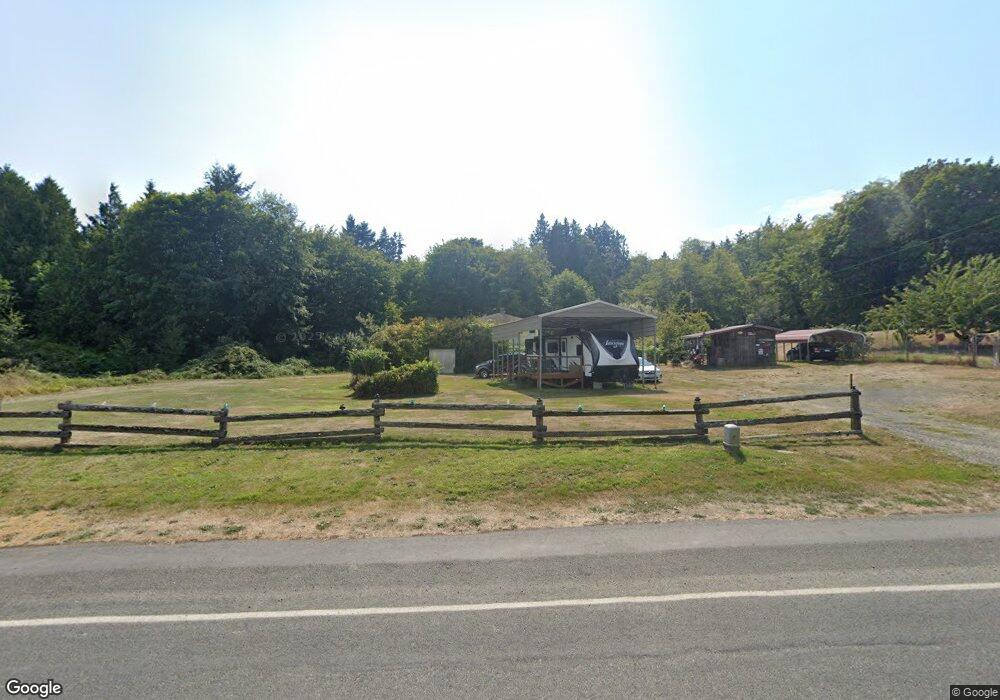
542 E Moore St Port Hadlock, WA 98339
Port Hadlock-Irondale NeighborhoodEstimated Value: $463,000 - $610,986
2
Beds
2
Baths
1,196
Sq Ft
$449/Sq Ft
Est. Value
About This Home
This home is located at 542 E Moore St, Port Hadlock, WA 98339 and is currently estimated at $537,247, approximately $449 per square foot. 542 E Moore St is a home with nearby schools including Chimacum Creek Primary School, Chimacum School Pi Program, and Chimacum Elementary School.
Create a Home Valuation Report for This Property
The Home Valuation Report is an in-depth analysis detailing your home's value as well as a comparison with similar homes in the area
Home Values in the Area
Average Home Value in this Area
Tax History Compared to Growth
Tax History
| Year | Tax Paid | Tax Assessment Tax Assessment Total Assessment is a certain percentage of the fair market value that is determined by local assessors to be the total taxable value of land and additions on the property. | Land | Improvement |
|---|---|---|---|---|
| 2024 | $1,796 | $538,688 | $160,650 | $378,038 |
| 2023 | $1,796 | $508,855 | $148,000 | $360,855 |
| 2022 | $3,266 | $443,168 | $127,800 | $315,368 |
| 2021 | $3,182 | $363,682 | $113,390 | $250,292 |
| 2020 | $3,025 | $332,965 | $103,530 | $229,435 |
| 2019 | $2,902 | $307,177 | $98,600 | $208,577 |
| 2018 | $3,186 | $296,748 | $98,600 | $198,148 |
| 2017 | $2,930 | $286,319 | $98,600 | $187,719 |
| 2016 | $2,941 | $281,007 | $94,600 | $186,407 |
| 2015 | $2,900 | $281,007 | $94,600 | $186,407 |
| 2014 | -- | $281,007 | $94,600 | $186,407 |
| 2013 | -- | $255,460 | $86,000 | $169,460 |
Source: Public Records
Map
Nearby Homes
- 371 E Price St
- 781 Irondale Rd
- 0 E Eugene St
- 1210 Irondale Rd
- 52 E Moore St
- 31 2nd St
- 0 NKA C St
- 0 N Andrew Ave
- 31 Petes Spur
- 611 Cedar Ave Unit 51
- 611 Cedar Ave Unit 33
- 611 Cedar Ave Unit 62
- 51 Thomas Dr
- 174 E Island View Ave
- 13 Loretta Ln
- 0 S Duquesne Ave
- 32 S Duquesne Ave
- 12 Loretta Ln
- 0 901024068 Unit NWM2387187
- 0 901024068 Unit Port Hadlock WA 9833