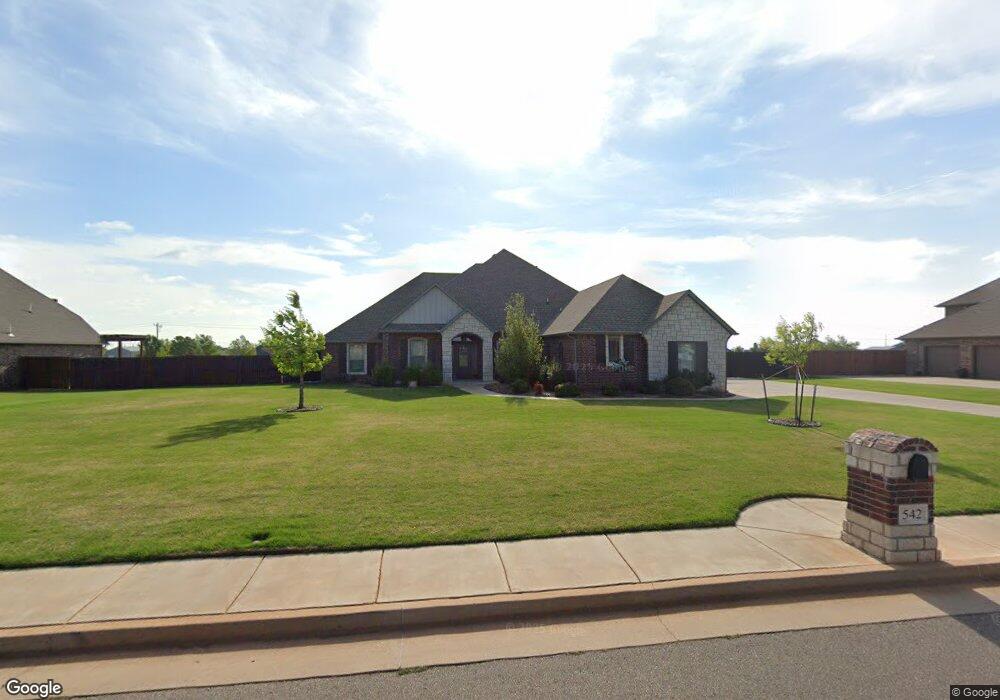
542 Harold Dr NE Piedmont, OK 73078
Estimated Value: $516,389 - $554,000
4
Beds
3
Baths
2,721
Sq Ft
$197/Sq Ft
Est. Value
About This Home
This home is located at 542 Harold Dr NE, Piedmont, OK 73078 and is currently estimated at $536,347, approximately $197 per square foot. 542 Harold Dr NE is a home with nearby schools including Piedmont Elementary School, Piedmont Intermediate Elementary School, and Piedmont Middle School.
Ownership History
Date
Name
Owned For
Owner Type
Purchase Details
Closed on
Aug 13, 2015
Sold by
Oklahoma Diamond Group Llc
Bought by
Schroeder Christy Louallen and Schroeder Michael Cory
Current Estimated Value
Home Financials for this Owner
Home Financials are based on the most recent Mortgage that was taken out on this home.
Original Mortgage
$165,000
Outstanding Balance
$65,642
Interest Rate
4.13%
Mortgage Type
New Conventional
Estimated Equity
$470,705
Purchase Details
Closed on
Nov 25, 2014
Sold by
Harold Rother Farms Inc
Bought by
Oklahoma Diamond Group Llc and Capital Homes Llc
Home Financials for this Owner
Home Financials are based on the most recent Mortgage that was taken out on this home.
Original Mortgage
$266,900
Interest Rate
3.93%
Mortgage Type
Construction
Create a Home Valuation Report for This Property
The Home Valuation Report is an in-depth analysis detailing your home's value as well as a comparison with similar homes in the area
Home Values in the Area
Average Home Value in this Area
Purchase History
| Date | Buyer | Sale Price | Title Company |
|---|---|---|---|
| Schroeder Christy Louallen | $332,500 | First American Title | |
| Oklahoma Diamond Group Llc | -- | Republic Title Company | |
| Capital Homes Llc | $40,000 | Old Republic Title Company |
Source: Public Records
Mortgage History
| Date | Status | Borrower | Loan Amount |
|---|---|---|---|
| Open | Schroeder Christy Louallen | $165,000 | |
| Previous Owner | Capital Homes Llc | $266,900 |
Source: Public Records
Tax History Compared to Growth
Tax History
| Year | Tax Paid | Tax Assessment Tax Assessment Total Assessment is a certain percentage of the fair market value that is determined by local assessors to be the total taxable value of land and additions on the property. | Land | Improvement |
|---|---|---|---|---|
| 2024 | $5,168 | $51,124 | $7,835 | $43,289 |
| 2023 | $5,168 | $49,635 | $7,362 | $42,273 |
| 2022 | $4,881 | $46,490 | $6,024 | $40,466 |
| 2021 | $4,907 | $45,136 | $4,800 | $40,336 |
| 2020 | $4,843 | $43,821 | $4,800 | $39,021 |
| 2019 | $4,465 | $42,545 | $4,800 | $37,745 |
| 2018 | $4,487 | $42,209 | $4,800 | $37,409 |
| 2017 | $4,449 | $42,016 | $4,800 | $37,216 |
| 2016 | $4,164 | $40,792 | $4,800 | $35,992 |
| 2015 | -- | $724 | $724 | $0 |
| 2014 | -- | $724 | $724 | $0 |
Source: Public Records
Map
Nearby Homes
- 2006 Ridgeview Ln
- 1364 Pineridge Cir
- 3117 Turkey Creek Ln NE
- 4095 Richards Way
- 4094 Richards Way
- 4144 Reta Cir
- 4130 Richards Way
- 4174 Richards Way
- 0 Edmond Rd NE
- 664 Paris Ave
- 606 Paris Ave
- 444 Paris Ave
- 4162 Hawthorne St
- 478 Paris Ave
- Plan 3947 at Magnolia Meadows II
- Plan 3316 at Magnolia Meadows II
- Plan 2732 Multi-Gen at Magnolia Meadows II
- Plan 2867 at Magnolia Meadows II
- Plan 2827 at Magnolia Meadows II
- Plan 2732+ at Magnolia Meadows II
- 502 Harold Dr NE
- 464 Harold Dr NE
- 620 Harold Dr NE
- 2139 Silver Crossings Cir
- 519 Harold Dr NE Unit NE
- 2173 Silver Crossings Cir
- 555 Harold Dr NE
- 665 Harold Dr NE
- 662 Harold Dr NE
- 2105 Silver Crossing Cir
- 2207 Silver Crossings Cir
- 469 Harold Dr NE
- 591 Harold Dr NE
- 2173 Silver Crossing Cir
- 2071 Silver Crossings Cir
- 2231 Silver Crossings Cir
- 404 Harold Dr NE
- 629 Harold Dr NE
- 425 Harold Dr NE
- 2698 Silver Crossings Cir