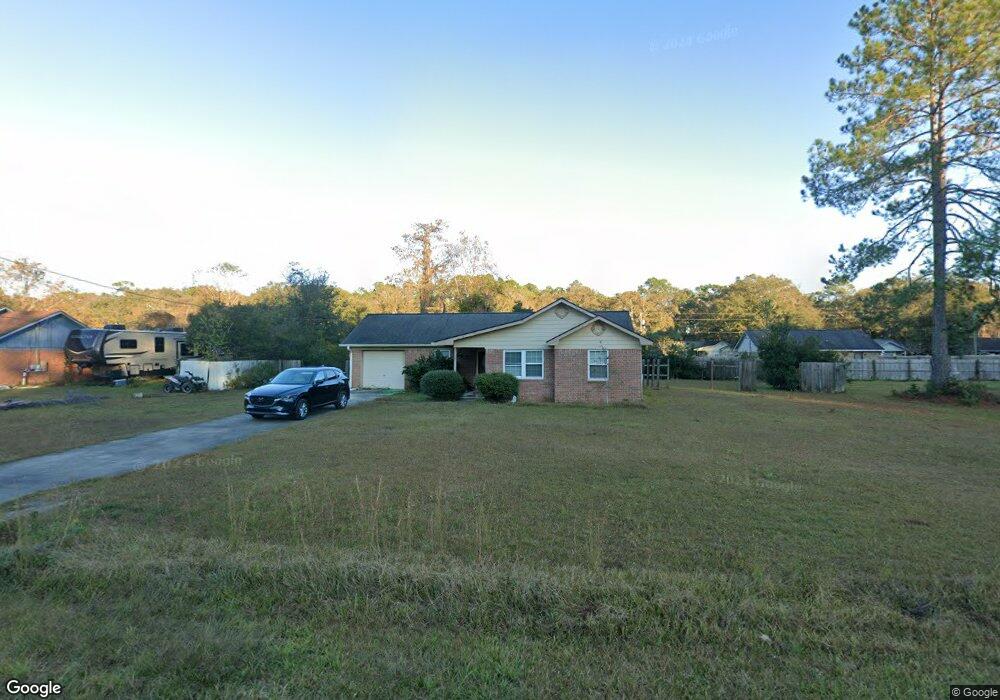
542 Jefferson Cir SE Allenhurst, GA 31301
Estimated Value: $192,643 - $205,000
3
Beds
2
Baths
1,087
Sq Ft
$182/Sq Ft
Est. Value
About This Home
This home is located at 542 Jefferson Cir SE, Allenhurst, GA 31301 and is currently estimated at $197,411, approximately $181 per square foot. 542 Jefferson Cir SE is a home located in Long County with nearby schools including Smiley Elementary School, McClelland Elementary School, and Long County High School.
Ownership History
Date
Name
Owned For
Owner Type
Purchase Details
Closed on
Mar 15, 2007
Sold by
Morales Francisco
Bought by
Robinson Delena C
Current Estimated Value
Home Financials for this Owner
Home Financials are based on the most recent Mortgage that was taken out on this home.
Original Mortgage
$95,900
Outstanding Balance
$58,079
Interest Rate
6.27%
Mortgage Type
VA
Estimated Equity
$139,332
Purchase Details
Closed on
Oct 30, 2002
Sold by
Morales Francisco
Bought by
Morales Francisco and Morales Suzanne M
Purchase Details
Closed on
May 30, 2001
Sold by
Dove Christopher
Bought by
Morales Francisco
Purchase Details
Closed on
Aug 15, 1997
Sold by
Veterans Affairs Sec
Bought by
Dove Christopher
Purchase Details
Closed on
Nov 5, 1996
Bought by
Veterans Affairs Sec
Purchase Details
Closed on
Aug 8, 1995
Bought by
Finger Anthony C
Purchase Details
Closed on
May 18, 1995
Bought by
John Hughes & Assoc
Create a Home Valuation Report for This Property
The Home Valuation Report is an in-depth analysis detailing your home's value as well as a comparison with similar homes in the area
Home Values in the Area
Average Home Value in this Area
Purchase History
| Date | Buyer | Sale Price | Title Company |
|---|---|---|---|
| Robinson Delena C | $93,900 | -- | |
| Morales Francisco | -- | -- | |
| Morales Francisco | $61,000 | -- | |
| Dove Christopher | -- | -- | |
| Veterans Affairs Sec | -- | -- | |
| Homeside Lending Inc | -- | -- | |
| Finger Anthony C | $57,500 | -- | |
| John Hughes & Assoc | $10,000 | -- |
Source: Public Records
Mortgage History
| Date | Status | Borrower | Loan Amount |
|---|---|---|---|
| Open | Robinson Delena C | $95,900 |
Source: Public Records
Tax History Compared to Growth
Tax History
| Year | Tax Paid | Tax Assessment Tax Assessment Total Assessment is a certain percentage of the fair market value that is determined by local assessors to be the total taxable value of land and additions on the property. | Land | Improvement |
|---|---|---|---|---|
| 2024 | $1,568 | $33,624 | $4,000 | $29,624 |
| 2023 | $1,284 | $33,624 | $4,000 | $29,624 |
| 2022 | $1,285 | $33,624 | $4,000 | $29,624 |
| 2021 | $1,246 | $34,528 | $4,000 | $30,528 |
| 2020 | $1,253 | $34,528 | $4,000 | $30,528 |
| 2019 | $1,253 | $34,528 | $4,000 | $30,528 |
| 2018 | $1,254 | $34,528 | $4,000 | $30,528 |
| 2017 | $1,254 | $34,528 | $4,000 | $30,528 |
| 2016 | $1,219 | $34,528 | $4,000 | $30,528 |
| 2015 | -- | $33,728 | $4,000 | $29,728 |
| 2014 | -- | $33,728 | $4,000 | $29,728 |
| 2013 | -- | $33,728 | $4,000 | $29,728 |
Source: Public Records
Map
Nearby Homes
- 304 Thompson Rd
- 801 Talmadge Rd
- 1105 Buckhead Loop
- 129 Vandiver Rd
- 1105 Buckhead Loop SE
- 1343 Talmadge Rd
- 311 Strickland Rd
- 169 Wellspring Terrace
- 127 Busbee Rd
- 964 Buckhead Loop SE
- 151 Hunters Branch Dr
- 1007 Buckhead Loop SE
- The Norman Plan at The Village at Sassafras
- The Duncan Plan at The Village at Sassafras
- The Jackson Plan at The Village at Sassafras
- The Marne With Bonus Plan at The Village at Sassafras
- The Powell Plan at The Village at Sassafras
- The Argyle Plan at The Village at Sassafras
- The Brunsen Plan at The Village at Sassafras
- The Catherine Plan at The Village at Sassafras
- 562 Jefferson Cir SE
- 520 Jefferson Cir SE
- 316 Jefferson Cir SE
- 340 Jefferson Cir SE
- 531 Jefferson Cir SE
- 523 Jefferson Cir SE
- 284 Jefferson Cir SE
- 553 Jefferson Cir SE
- 505 Jefferson Cir SE
- 352 Jefferson Cir SE
- 574 Jefferson Cir SE
- 581 Jefferson Cir SE
- 262 Jefferson Cir SE
- 317 Jefferson Cir SE
- 483 Jefferson Cir SE
- 329 Jefferson Cir SE
- 384 Jefferson Cir SE
- 299 Jefferson Cir SE
- 355 Jefferson Cir SE
- 598 Jefferson Cir SE