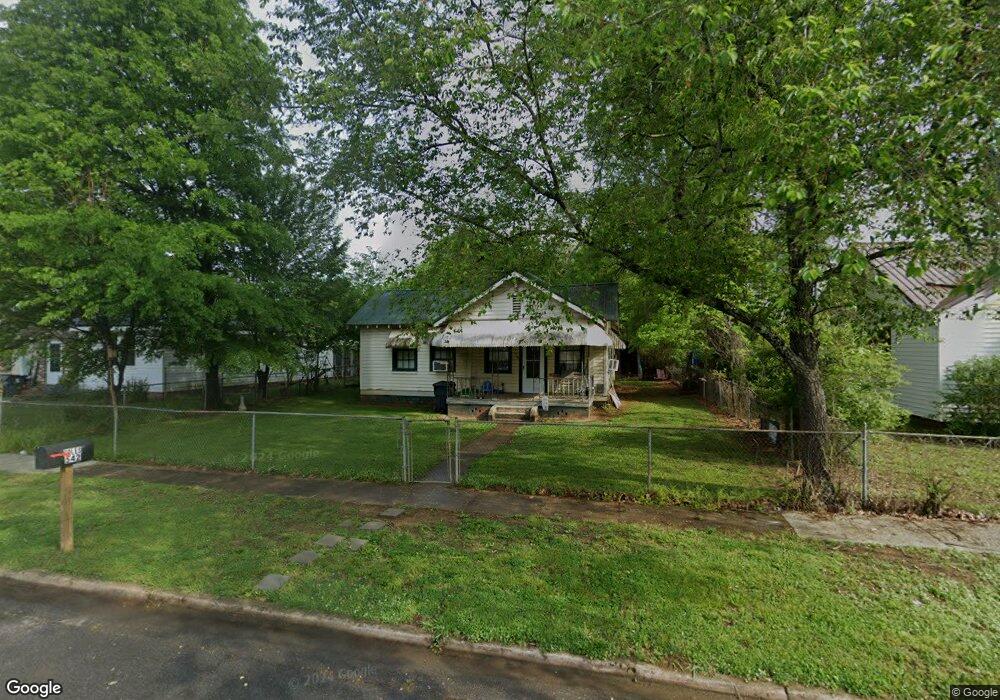
542 Lane St Rockmart, GA 30153
Estimated Value: $144,000 - $199,000
3
Beds
1
Bath
1,294
Sq Ft
$128/Sq Ft
Est. Value
About This Home
This home is located at 542 Lane St, Rockmart, GA 30153 and is currently estimated at $166,226, approximately $128 per square foot. 542 Lane St is a home located in Polk County.
Ownership History
Date
Name
Owned For
Owner Type
Purchase Details
Closed on
Nov 30, 2021
Sold by
Hutcheson Carol S
Bought by
Soles Jill and Soles Charles
Current Estimated Value
Purchase Details
Closed on
Feb 1, 1988
Sold by
Rovinson Terry L
Bought by
Statham Franklin
Purchase Details
Closed on
Jan 1, 1987
Sold by
Statham Franklin
Bought by
Robinson Terry L
Purchase Details
Closed on
Dec 5, 1986
Sold by
Soles Charles and Soles Ancy
Bought by
Statham Franklin
Purchase Details
Closed on
Oct 15, 1982
Sold by
Statham Franklin
Bought by
Soles Charles and Soles Ancy
Purchase Details
Closed on
Sep 10, 1982
Sold by
Hindmon Richard D
Bought by
Statham Franklin
Purchase Details
Closed on
Jul 17, 1972
Sold by
Hindmon Mildred R
Bought by
Hindmon Richard D
Purchase Details
Closed on
May 20, 1971
Bought by
Hindmon Mildred R
Purchase Details
Closed on
Aug 11, 1966
Sold by
Motes Raiford
Bought by
Himdmon Mildred R
Purchase Details
Closed on
Jan 1, 1901
Bought by
Motes Raiford
Create a Home Valuation Report for This Property
The Home Valuation Report is an in-depth analysis detailing your home's value as well as a comparison with similar homes in the area
Home Values in the Area
Average Home Value in this Area
Purchase History
| Date | Buyer | Sale Price | Title Company |
|---|---|---|---|
| Soles Jill | -- | -- | |
| Statham Franklin | $2,000 | -- | |
| Robinson Terry L | $24,900 | -- | |
| Statham Franklin | -- | -- | |
| Soles Charles | -- | -- | |
| Statham Franklin | -- | -- | |
| Hindmon Richard D | -- | -- | |
| Hindmon Mildred R | -- | -- | |
| Himdmon Mildred R | -- | -- | |
| Motes Raiford | -- | -- |
Source: Public Records
Tax History Compared to Growth
Tax History
| Year | Tax Paid | Tax Assessment Tax Assessment Total Assessment is a certain percentage of the fair market value that is determined by local assessors to be the total taxable value of land and additions on the property. | Land | Improvement |
|---|---|---|---|---|
| 2024 | $1,037 | $36,418 | $8,000 | $28,418 |
| 2023 | $602 | $18,770 | $1,120 | $17,650 |
| 2022 | $381 | $16,066 | $1,120 | $14,946 |
| 2021 | $386 | $16,066 | $1,120 | $14,946 |
| 2020 | $387 | $16,066 | $1,120 | $14,946 |
| 2019 | $412 | $15,355 | $610 | $14,745 |
| 2018 | $410 | $14,885 | $610 | $14,275 |
| 2017 | $405 | $14,885 | $610 | $14,275 |
| 2016 | $405 | $14,885 | $610 | $14,275 |
| 2015 | $410 | $15,022 | $610 | $14,412 |
| 2014 | $404 | $14,704 | $1,328 | $13,376 |
Source: Public Records
Map
Nearby Homes
- 451 Clearwater St
- 247 Litchfield St
- 232 Litchfield St
- 200 Litchfield St
- 530 Hogue Ave
- 0 Nathan Dean Bypass Unit 10434274
- 0 Peachtree Rd Unit 19311295
- 7667 Georgia 101
- 825 Wilson St
- 307 & 309 Pine St
- 11 Lot
- 571 N Marble St
- 540 N Marble St
- 123 Nicole Cir
- 222 Whitley Crossing
- 582 Barnwood Dr
- 522 Jackson St
- 119 Pearl St
- 605 Gates Dr
- 2470 Nathan Dean Pkwy