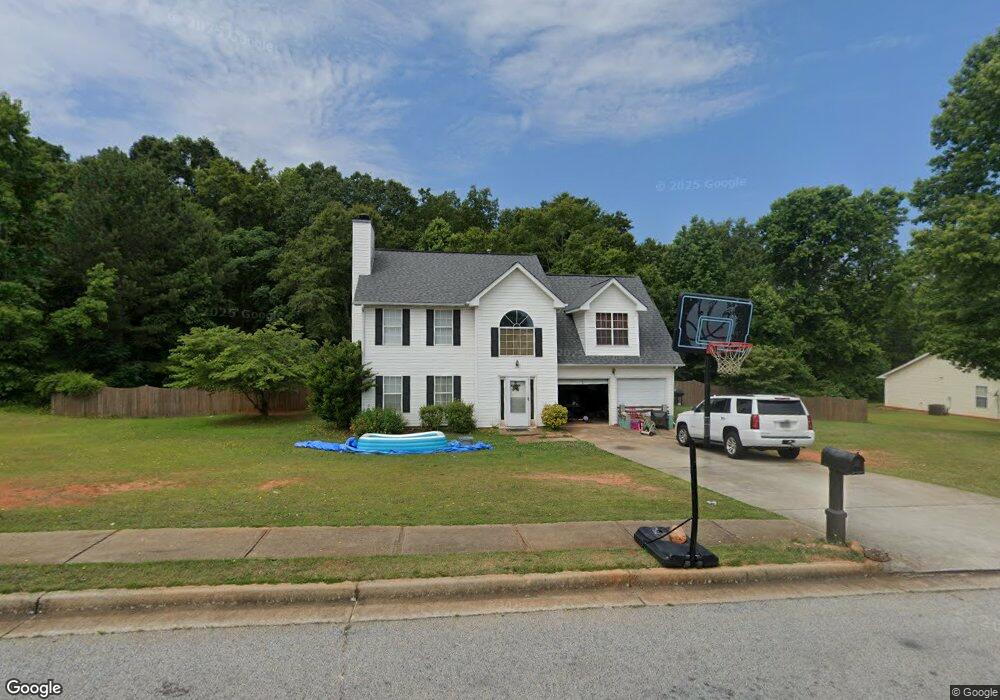
542 Meadows Ln Unit 29 Social Circle, GA 30025
Estimated Value: $275,000 - $334,000
3
Beds
3
Baths
1,642
Sq Ft
$183/Sq Ft
Est. Value
About This Home
This home is located at 542 Meadows Ln Unit 29, Social Circle, GA 30025 and is currently estimated at $300,927, approximately $183 per square foot. 542 Meadows Ln Unit 29 is a home located in Walton County with nearby schools including Social Circle Primary School, Social Circle Elementary School, and Social Circle Middle School.
Ownership History
Date
Name
Owned For
Owner Type
Purchase Details
Closed on
Jan 15, 2015
Sold by
Home Place Partners Iii Llc
Bought by
Thomas Lakeechia
Current Estimated Value
Home Financials for this Owner
Home Financials are based on the most recent Mortgage that was taken out on this home.
Original Mortgage
$113,898
Outstanding Balance
$87,337
Interest Rate
3.87%
Mortgage Type
FHA
Estimated Equity
$213,590
Purchase Details
Closed on
Nov 3, 2014
Sold by
Home Place Partners Llc
Bought by
Home Place Partners Ii Llc
Purchase Details
Closed on
Oct 2, 2013
Sold by
Koerner Nathan A
Bought by
Home Place Partners Lc
Purchase Details
Closed on
Oct 4, 2002
Sold by
Meadows Builder Grp
Bought by
Koerner Nathan A
Home Financials for this Owner
Home Financials are based on the most recent Mortgage that was taken out on this home.
Original Mortgage
$120,360
Interest Rate
6.21%
Mortgage Type
VA
Create a Home Valuation Report for This Property
The Home Valuation Report is an in-depth analysis detailing your home's value as well as a comparison with similar homes in the area
Home Values in the Area
Average Home Value in this Area
Purchase History
| Date | Buyer | Sale Price | Title Company |
|---|---|---|---|
| Thomas Lakeechia | $116,000 | -- | |
| Home Place Partners Ii Llc | -- | -- | |
| Home Place Partners Lc | $70,000 | -- | |
| Koerner Nathan A | $118,000 | -- |
Source: Public Records
Mortgage History
| Date | Status | Borrower | Loan Amount |
|---|---|---|---|
| Open | Thomas Lakeechia | $113,898 | |
| Previous Owner | Koerner Nathan A | $120,360 |
Source: Public Records
Tax History Compared to Growth
Tax History
| Year | Tax Paid | Tax Assessment Tax Assessment Total Assessment is a certain percentage of the fair market value that is determined by local assessors to be the total taxable value of land and additions on the property. | Land | Improvement |
|---|---|---|---|---|
| 2024 | $2,748 | $89,480 | $17,600 | $71,880 |
| 2023 | $2,699 | $85,520 | $16,000 | $69,520 |
| 2022 | $497 | $84,720 | $14,000 | $70,720 |
| 2021 | $497 | $64,920 | $8,000 | $56,920 |
| 2020 | $510 | $62,960 | $8,000 | $54,960 |
| 2019 | $521 | $58,120 | $8,000 | $50,120 |
| 2018 | $521 | $58,120 | $8,000 | $50,120 |
| 2017 | $2,163 | $51,760 | $8,000 | $43,760 |
| 2016 | $472 | $41,640 | $8,000 | $33,640 |
| 2015 | $351 | $31,200 | $6,000 | $25,200 |
| 2014 | $331 | $27,840 | $0 | $0 |
Source: Public Records
Map
Nearby Homes
- 1302 N Cherokee Rd
- 1526 N Cherokee Rd
- 684 N Cherokee Rd
- 741 Jackson Ct
- 695 Park Place Way
- 690 Park Place Way
- 960 Park Place St
- 1244 Morrow Dr
- 670 Park Place Way
- 939 Park Place St
- 931 Park Place St
- 853 Crossroads Ct
- 843 Crossroads Ct
- 821 Crossroads Ct
- 815 Crossroads Ct
- 310 Crossroads Dr
- 443 Windsong Ln
- 413 Crossroads Dr
- 381 Crossroads Dr
- 228 Oak Dr NE
- 542 Meadows Ln
- 558 Meadows Ln
- 528 Meadows Ln
- 563 Meadows Ln
- 523 Meadows Ln
- 514 Meadows Ln
- 1074 Bateman Dr
- 1090 Bateman Dr
- 570 Meadows Ln
- 1060 Bateman Dr
- 511 Meadows Ln
- 1052 Bateman Dr
- 586 Meadows Ln
- 586 Meadow Lane Dr
- 504 Meadows Ln
- 1083 Bateman Dr
- 1065 Bateman Dr
- 503 Meadows Ln
- 500 Meadows Ln
- 603 Meadows Ln