542 Newburne Pointe Unit Bldg-Unit Bloomfield Hills, MI 48304
Estimated Value: $379,000 - $434,000
2
Beds
2
Baths
1,902
Sq Ft
$214/Sq Ft
Est. Value
About This Home
This home is located at 542 Newburne Pointe Unit Bldg-Unit, Bloomfield Hills, MI 48304 and is currently estimated at $406,751, approximately $213 per square foot. 542 Newburne Pointe Unit Bldg-Unit is a home located in Oakland County with nearby schools including Eastover Elementary School, Bloomfield Hills High School, and Arts & Technology Academy of Pontiac.
Ownership History
Date
Name
Owned For
Owner Type
Purchase Details
Closed on
Aug 28, 2014
Sold by
Marcus Constance L
Bought by
Chung Jane
Current Estimated Value
Purchase Details
Closed on
Aug 17, 2012
Sold by
Smyth Sean
Bought by
Marcus Constance L
Purchase Details
Closed on
Jul 18, 2008
Sold by
Jpmorgan Chase Bank Na
Bought by
Homesales Inc Of Delaware
Purchase Details
Closed on
Jul 8, 2008
Sold by
Atesian Darren P and Atesian Ara J
Bought by
Jpmorgan Chase Bank Na
Purchase Details
Closed on
Dec 11, 2007
Sold by
Atesian Ara J
Bought by
Atesian Darren P
Purchase Details
Closed on
May 10, 2002
Sold by
Rahmanian Kathy
Bought by
Atesian Ara J
Create a Home Valuation Report for This Property
The Home Valuation Report is an in-depth analysis detailing your home's value as well as a comparison with similar homes in the area
Home Values in the Area
Average Home Value in this Area
Purchase History
| Date | Buyer | Sale Price | Title Company |
|---|---|---|---|
| Chung Jane | $217,000 | Devon Title Agency | |
| Marcus Constance L | $144,500 | Metro Title Agency Llc | |
| Homesales Inc Of Delaware | -- | None Available | |
| Jpmorgan Chase Bank Na | $139,123 | None Available | |
| Atesian Darren P | -- | None Available | |
| Atesian Ara J | -- | -- |
Source: Public Records
Tax History Compared to Growth
Tax History
| Year | Tax Paid | Tax Assessment Tax Assessment Total Assessment is a certain percentage of the fair market value that is determined by local assessors to be the total taxable value of land and additions on the property. | Land | Improvement |
|---|---|---|---|---|
| 2024 | $3,144 | $172,510 | $0 | $0 |
| 2023 | $2,999 | $156,110 | $0 | $0 |
| 2022 | $5,804 | $139,820 | $0 | $0 |
| 2021 | $5,609 | $133,400 | $0 | $0 |
| 2020 | $2,643 | $128,140 | $0 | $0 |
| 2019 | $5,322 | $120,060 | $0 | $0 |
| 2018 | $5,036 | $115,440 | $0 | $0 |
| 2017 | $5,147 | $113,790 | $0 | $0 |
| 2016 | $5,128 | $106,150 | $0 | $0 |
| 2015 | -- | $99,800 | $0 | $0 |
| 2014 | -- | $84,700 | $0 | $0 |
| 2011 | -- | $77,370 | $0 | $0 |
Source: Public Records
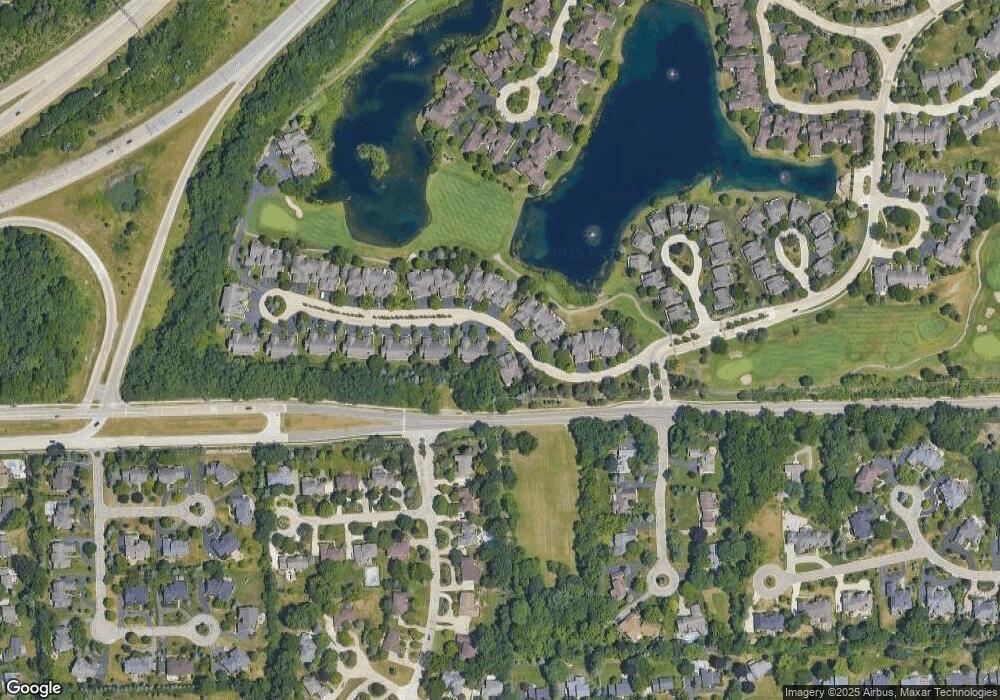
Map
Nearby Homes
- 692 Brockmoor Ln
- 584 Cambridge Way Unit 522
- 536 Cambridge Way
- 457 Cambridge Way
- 700 E Square Lake Rd
- 2409 Wildbrook Run Unit 182
- 689 E Fox Hills Dr Unit 65
- 635 E Fox Hills Dr Unit F41
- 654 E Fox Hills Dr
- 667 E Fox Hills Dr Unit H59
- 587 E Fox Hills Dr
- 737 E Fox Hills Dr Unit 180
- 723 E Fox Hills Dr Unit X186
- 2755 Hunters Hill Rd
- 2615 Warwick Dr
- 448 Fox Hills Dr S Unit 3
- 909 Tartan Trail Unit 203
- 433 Fox Hills Dr S Unit 5
- 480 Fox Hills Dr N Unit 6
- 454 N Fox Hills Dr Unit A-8
- 477 Newburne Pointe Unit 31-Bldgh
- 908 Upper Scotsborough Way Unit X 90
- 908 Upper Scotsborough Way Unit BldgX-Unit90
- 539 Newburne Pointe Unit Bldg-Unit
- 655 Brockmoor Ln Unit 67
- 908 Upper Scotsborough Way
- 696 Brockmoor Ln Unit W88
- 690 Brockmoor Ln Unit W86
- 731 Brockmoor Ln Unit 84
- 723 Brockmoor Ln
- 715 Brockmoor Ln
- 707 Brockmoor Ln
- 703 Brockmoor Ln Unit U79
- 699 Brockmoor Ln
- 691 Brockmoor Ln
- 687 Brockmoor Ln
- 683 Brockmoor Ln
- 675 Brockmoor Ln
- 663 Brockmoor Ln
- 659 Brockmoor Ln