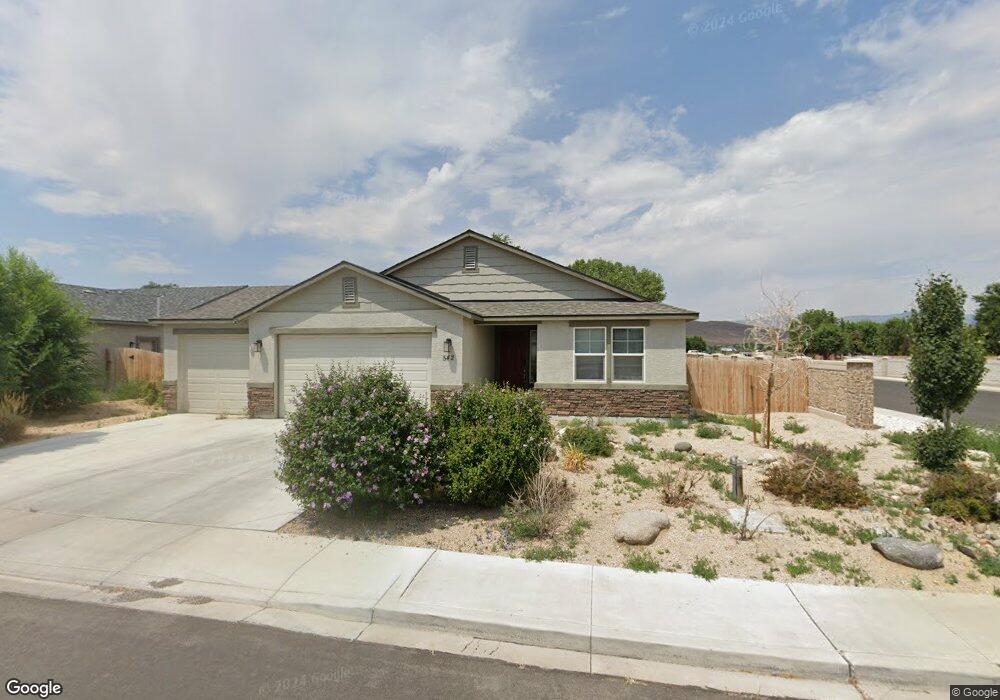
542 Osprey Way Fernley, NV 89408
Estimated Value: $406,233 - $435,000
4
Beds
2
Baths
1,743
Sq Ft
$240/Sq Ft
Est. Value
About This Home
This home is located at 542 Osprey Way, Fernley, NV 89408 and is currently estimated at $417,808, approximately $239 per square foot. 542 Osprey Way is a home located in Lyon County with nearby schools including Fernley Elementary School, Fernley Intermediate School, and Fernley High School.
Ownership History
Date
Name
Owned For
Owner Type
Purchase Details
Closed on
Feb 21, 2019
Sold by
Jones Richard L
Bought by
Khimich Valeriy
Current Estimated Value
Home Financials for this Owner
Home Financials are based on the most recent Mortgage that was taken out on this home.
Original Mortgage
$319,000
Outstanding Balance
$279,886
Interest Rate
4.4%
Mortgage Type
Unknown
Estimated Equity
$137,922
Purchase Details
Closed on
Aug 2, 2018
Sold by
Jones Richard
Bought by
Jones Richard L and Dick Jones Revocable Trust
Purchase Details
Closed on
Mar 12, 2018
Sold by
The Meadows Ii Llc
Bought by
Jones Richard
Home Financials for this Owner
Home Financials are based on the most recent Mortgage that was taken out on this home.
Original Mortgage
$269,000
Interest Rate
4.4%
Mortgage Type
Unknown
Purchase Details
Closed on
Feb 25, 2018
Sold by
Khimich Alina
Bought by
Khimich Valeriy
Home Financials for this Owner
Home Financials are based on the most recent Mortgage that was taken out on this home.
Original Mortgage
$269,000
Interest Rate
4.4%
Mortgage Type
Unknown
Purchase Details
Closed on
Apr 15, 2010
Sold by
Svww Ii Llc
Bought by
Belanger Brian L and Belanger Mariann F
Create a Home Valuation Report for This Property
The Home Valuation Report is an in-depth analysis detailing your home's value as well as a comparison with similar homes in the area
Home Values in the Area
Average Home Value in this Area
Purchase History
| Date | Buyer | Sale Price | Title Company |
|---|---|---|---|
| Khimich Valeriy | $319,000 | Ticor Title | |
| Jones Richard L | -- | First American Title Ins | |
| Jones Richard | $291,658 | First American Title Ins Co | |
| Khimich Valeriy | -- | Ticor Title Reno | |
| Belanger Brian L | $100,000 | Western Nevada Title Company |
Source: Public Records
Mortgage History
| Date | Status | Borrower | Loan Amount |
|---|---|---|---|
| Open | Khimich Valeriy | $319,000 | |
| Previous Owner | Khimich Valeriy | $269,000 |
Source: Public Records
Tax History Compared to Growth
Tax History
| Year | Tax Paid | Tax Assessment Tax Assessment Total Assessment is a certain percentage of the fair market value that is determined by local assessors to be the total taxable value of land and additions on the property. | Land | Improvement |
|---|---|---|---|---|
| 2025 | $4,309 | $121,037 | $36,750 | $84,287 |
| 2024 | $4,400 | $121,171 | $36,750 | $84,420 |
| 2023 | $4,400 | $115,513 | $36,750 | $78,763 |
| 2022 | $3,804 | $109,434 | $36,750 | $72,684 |
| 2021 | $3,578 | $103,907 | $33,250 | $70,657 |
| 2020 | $3,341 | $100,267 | $33,250 | $67,017 |
| 2019 | $3,175 | $92,255 | $28,000 | $64,255 |
| 2018 | $3,047 | $77,312 | $14,700 | $62,612 |
| 2017 | $648 | $7,350 | $7,350 | $0 |
| 2016 | $353 | $4,040 | $4,040 | $0 |
| 2015 | $375 | $4,040 | $4,040 | $0 |
| 2014 | $373 | $4,040 | $4,040 | $0 |
Source: Public Records
Map
Nearby Homes
- 544 Osprey Way
- 541 White Eagle Ln
- 546 Osprey Way
- 541 Osprey Way
- 498 Lilac Ln
- 543 Osprey Way
- 499 Lilac Ln
- 551 White Eagle Ln
- 545 Osprey Way
- 548 Osprey Way
- 497 Lilac Ln
- 496 Lilac Ln
- 530 White Eagle Ln
- 547 Osprey Way
- 540 White Eagle Ln Unit Lot 47
- 540 White Eagle Ln
- 550 White Eagle Ln Unit Lot 46
- 550 White Eagle Ln
- 556 Osprey Way
- 495 Lilac Ln