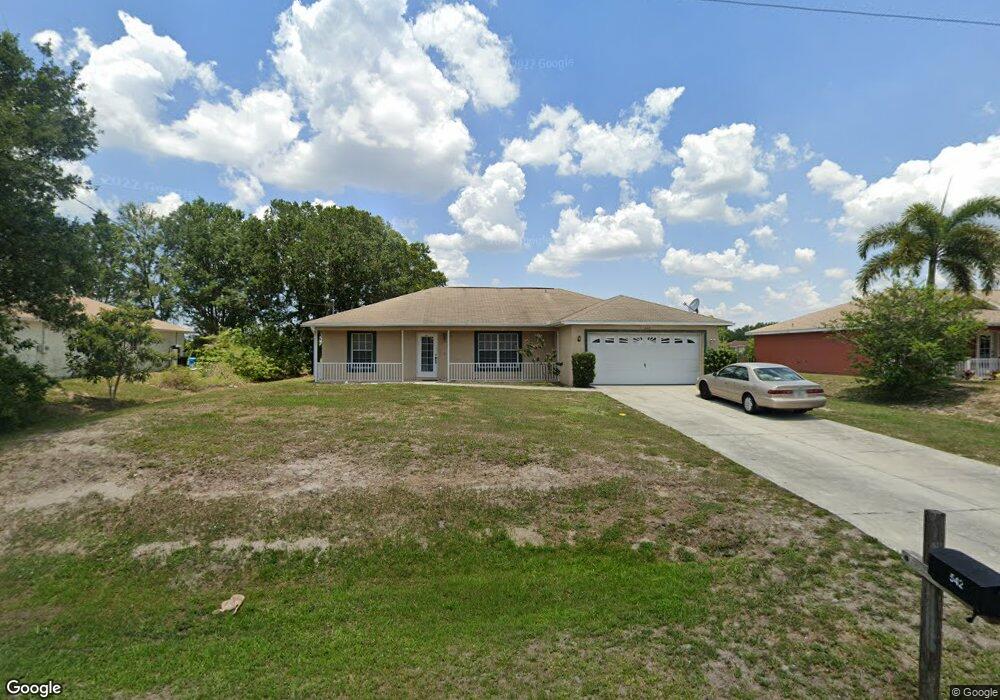
542 Pachman Cir Unit 16 Lehigh Acres, FL 33974
Alabama NeighborhoodEstimated Value: $256,927 - $312,000
3
Beds
2
Baths
1,409
Sq Ft
$201/Sq Ft
Est. Value
About This Home
This home is located at 542 Pachman Cir Unit 16, Lehigh Acres, FL 33974 and is currently estimated at $283,732, approximately $201 per square foot. 542 Pachman Cir Unit 16 is a home located in Lee County with nearby schools including Lehigh Elementary School, Gateway Elementary School, and The Alva School.
Ownership History
Date
Name
Owned For
Owner Type
Purchase Details
Closed on
Feb 4, 2022
Sold by
Fahmida Rahman
Bought by
Rahman Property Group Llc
Current Estimated Value
Purchase Details
Closed on
Jan 12, 2016
Sold by
Clearview Lehigh Llc
Bought by
Rahman Mohammed M and Rahman Fahmida
Purchase Details
Closed on
Aug 21, 2011
Sold by
Hat Trick Capital Llc
Bought by
Clearview Lehigh Llc
Purchase Details
Closed on
Aug 9, 2011
Sold by
Sperrazza John R
Bought by
Asset Link Llc
Purchase Details
Closed on
Mar 1, 2002
Sold by
1St Home Bldr
Bought by
Sperrazza John R and Sperrazza Tammy A
Home Financials for this Owner
Home Financials are based on the most recent Mortgage that was taken out on this home.
Original Mortgage
$109,323
Interest Rate
6.98%
Mortgage Type
VA
Create a Home Valuation Report for This Property
The Home Valuation Report is an in-depth analysis detailing your home's value as well as a comparison with similar homes in the area
Home Values in the Area
Average Home Value in this Area
Purchase History
| Date | Buyer | Sale Price | Title Company |
|---|---|---|---|
| Rahman Property Group Llc | -- | Green Schoenfeld & Kyle Llp | |
| Rahman Mohammed M | $119,750 | Patriot Title Services Llc | |
| Clearview Lehigh Llc | $58,500 | Title Specialists Of The Gul | |
| Hat Trick Capital Llc | -- | None Available | |
| Asset Link Llc | $44,600 | None Available | |
| Sperrazza John R | -- | -- |
Source: Public Records
Mortgage History
| Date | Status | Borrower | Loan Amount |
|---|---|---|---|
| Previous Owner | Sperrazza John R | $109,323 |
Source: Public Records
Tax History Compared to Growth
Tax History
| Year | Tax Paid | Tax Assessment Tax Assessment Total Assessment is a certain percentage of the fair market value that is determined by local assessors to be the total taxable value of land and additions on the property. | Land | Improvement |
|---|---|---|---|---|
| 2025 | $3,440 | $205,701 | $17,765 | $187,936 |
| 2024 | $2,701 | $223,989 | $16,609 | $207,380 |
| 2023 | $3,419 | $226,602 | $13,322 | $213,280 |
| 2022 | $2,701 | $156,294 | $0 | $0 |
| 2021 | $2,347 | $142,085 | $6,500 | $135,585 |
| 2020 | $2,271 | $133,247 | $5,500 | $127,747 |
| 2019 | $2,185 | $121,118 | $4,500 | $116,618 |
| 2018 | $2,160 | $118,699 | $4,255 | $114,444 |
| 2017 | $2,091 | $113,049 | $4,325 | $108,724 |
| 2016 | $1,647 | $86,694 | $4,325 | $82,369 |
| 2015 | $1,546 | $78,989 | $3,760 | $75,229 |
| 2014 | -- | $72,192 | $2,350 | $69,842 |
| 2013 | -- | $59,991 | $2,700 | $57,291 |
Source: Public Records
Map
Nearby Homes
- 509 Pennfield Ave Unit 1
- 513 Peerless Cir
- 502 Palencia Ct
- 506 Palencia Ct
- 113 Theodore Vail St E
- 569 Bourse Cir
- 575 Bourse Cir Unit 18
- 114 Preston St
- 110 Talisman St
- 395 Palora Ave Unit 5
- 395 Pace Ave
- 102 Parish Dr
- 394 Palora Ave
- 2508 51st St W
- 106 Parish Dr
- 391 Palencia Ave
- 389 Palencia Ave
- 2512 52nd St SW
- 131 Grant Blvd
- 2514 52nd St SW
- 540 Pachman Cir
- 544 Pachman Cir
- 538 Pachman Cir
- 547 Pachman Cir
- 525 Paloma Ave
- 536 Pachman Cir
- 534 Pachman Cir Unit 16
- 171 Grant Blvd Unit 16
- 169 Grant Blvd
- 517 Paloma Ave
- 532 Pachman Cir
- 549 Pachman Cir
- 167 Grant Blvd
- 550 Pachman Cir
- 529 Paloma Ave
- 165 Grant Blvd
- 526 Peerless Cir
- 551 Pachman Cir
- 524 Paloma Ave