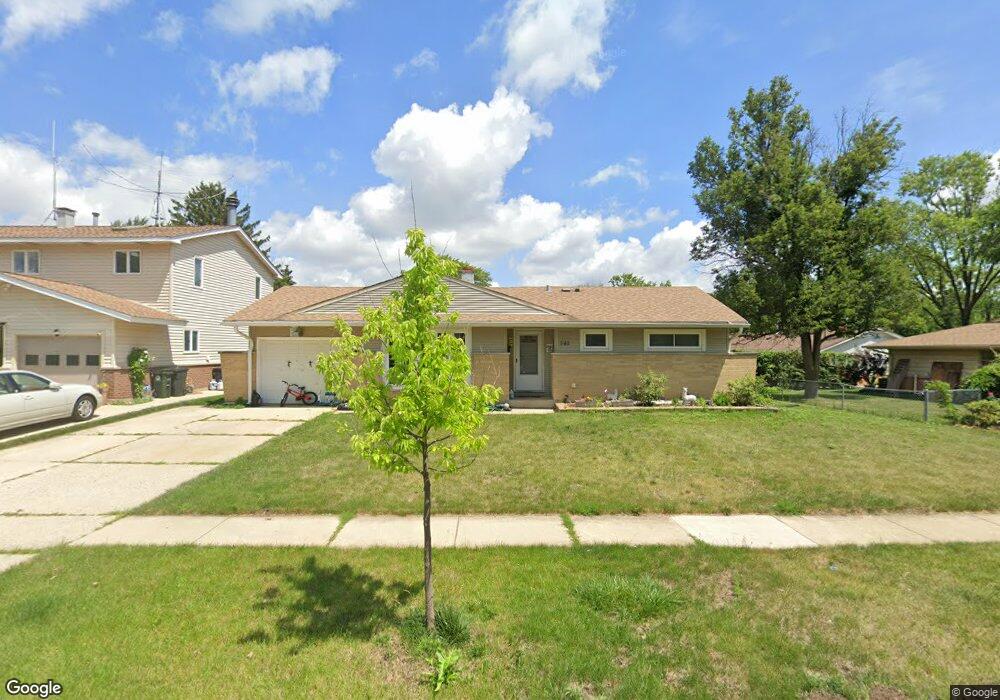
542 Ridgewood Rd Elk Grove Village, IL 60007
Elk Grove Village East NeighborhoodEstimated Value: $367,000 - $408,560
3
Beds
2
Baths
1,771
Sq Ft
$223/Sq Ft
Est. Value
About This Home
This home is located at 542 Ridgewood Rd, Elk Grove Village, IL 60007 and is currently estimated at $394,390, approximately $222 per square foot. 542 Ridgewood Rd is a home located in Cook County with nearby schools including Rupley Elementary School, Grove Jr High School, and Elk Grove High School.
Ownership History
Date
Name
Owned For
Owner Type
Purchase Details
Closed on
Jun 6, 2024
Sold by
Giblin Michael and Giblin Krysta
Bought by
Giblin Michael
Current Estimated Value
Purchase Details
Closed on
Aug 14, 2020
Sold by
Giblin Michael and Reed Krysta
Bought by
Giblin Michael and Giblin Krysta
Home Financials for this Owner
Home Financials are based on the most recent Mortgage that was taken out on this home.
Original Mortgage
$244,000
Interest Rate
2.8%
Mortgage Type
New Conventional
Purchase Details
Closed on
Aug 23, 2017
Sold by
Schoen John W
Bought by
Giblin Michael and Reed Krysta
Home Financials for this Owner
Home Financials are based on the most recent Mortgage that was taken out on this home.
Original Mortgage
$259,218
Interest Rate
4.37%
Mortgage Type
FHA
Purchase Details
Closed on
Nov 13, 1996
Sold by
Schoen John W and Schoen Carol E
Bought by
Schoen John W and Schoen Carol E
Create a Home Valuation Report for This Property
The Home Valuation Report is an in-depth analysis detailing your home's value as well as a comparison with similar homes in the area
Home Values in the Area
Average Home Value in this Area
Purchase History
| Date | Buyer | Sale Price | Title Company |
|---|---|---|---|
| Giblin Michael | -- | None Listed On Document | |
| Giblin Michael | -- | Chicago Title | |
| Giblin Michael | $264,000 | Attorneys Title Guaranty Fun | |
| Schoen John W | -- | -- |
Source: Public Records
Mortgage History
| Date | Status | Borrower | Loan Amount |
|---|---|---|---|
| Previous Owner | Giblin Michael | $244,000 | |
| Previous Owner | Giblin Michael | $259,218 |
Source: Public Records
Tax History Compared to Growth
Tax History
| Year | Tax Paid | Tax Assessment Tax Assessment Total Assessment is a certain percentage of the fair market value that is determined by local assessors to be the total taxable value of land and additions on the property. | Land | Improvement |
|---|---|---|---|---|
| 2024 | $7,284 | $32,000 | $5,862 | $26,138 |
| 2023 | $6,983 | $32,000 | $5,862 | $26,138 |
| 2022 | $6,983 | $32,000 | $5,862 | $26,138 |
| 2021 | $6,965 | $28,421 | $3,664 | $24,757 |
| 2020 | $6,771 | $28,421 | $3,664 | $24,757 |
| 2019 | $6,853 | $31,579 | $3,664 | $27,915 |
| 2018 | $6,255 | $26,238 | $3,297 | $22,941 |
| 2017 | $7,146 | $26,238 | $3,297 | $22,941 |
| 2016 | $5,586 | $26,238 | $3,297 | $22,941 |
| 2015 | $6,372 | $23,794 | $2,748 | $21,046 |
| 2014 | $5,121 | $23,794 | $2,748 | $21,046 |
| 2013 | $4,978 | $23,794 | $2,748 | $21,046 |
Source: Public Records
Map
Nearby Homes
- 539 Ridgewood Rd
- 532 Landmeier Rd
- 509 Shadywood Ln
- 623 Willow Ln
- 105 Crest Ave
- 301 Forest View Ave
- 510 Oakton St
- 1520 Grove Terrace
- 630 Perrie Dr Unit 104
- 301 S Arlington Heights Rd
- 66 Forest Ln
- 322 Charing Cross Rd
- 50 Ridgewood Rd
- 550 Ridge Ave
- 217 Edgeware Rd
- 865 Love St
- 836 Bonita Ave
- 370 E Elk Grove Blvd
- 468 Birchwood Ave
- 679 W Elk Grove Blvd
- 540 Ridgewood Rd
- 546 Ridgewood Rd
- 210 Wildwood Rd
- 541 Edgewood Ln
- 536 Ridgewood Rd
- 539 Edgewood Ln
- 545 Edgewood Ln
- 541 Ridgewood Rd
- 543 Ridgewood Rd
- 545 Ridgewood Rd
- 534 Ridgewood Rd
- 537 Edgewood Ln
- 537 Ridgewood Rd
- 236 Wildwood Rd
- 530 Ridgewood Rd
- 213 Wildwood Rd
- 535 Edgewood Ln
- 219 Wildwood Rd
- 207 Wildwood Rd
- 156 Wildwood Rd