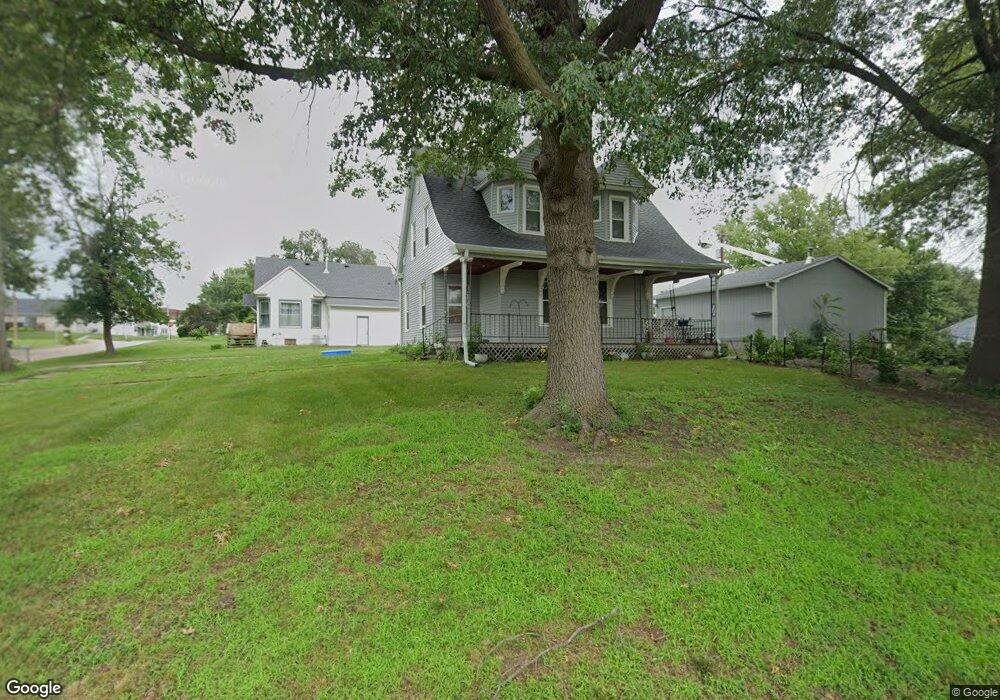
542 S 3rd St Seward, NE 68434
Estimated Value: $213,707 - $248,000
3
Beds
2
Baths
1,444
Sq Ft
$156/Sq Ft
Est. Value
About This Home
This home is located at 542 S 3rd St, Seward, NE 68434 and is currently estimated at $225,927, approximately $156 per square foot. 542 S 3rd St is a home located in Seward County with nearby schools including Seward Elementary School, Seward Middle School, and Seward High School.
Ownership History
Date
Name
Owned For
Owner Type
Purchase Details
Closed on
Oct 17, 2025
Sold by
Osborne Barbara J and Osborne Troy D
Bought by
Troy And Barbara Osborne Living Trust and Osborne
Current Estimated Value
Purchase Details
Closed on
Sep 18, 2018
Sold by
Hobson Barabra J
Bought by
Osborne Barbara J
Purchase Details
Closed on
Aug 7, 2015
Sold by
Hobson Mitchi
Bought by
Osborne Barbara T
Purchase Details
Closed on
Jun 16, 2015
Sold by
Osborne Barbara J and Osborne Troy D
Bought by
Hobson Mitchell
Create a Home Valuation Report for This Property
The Home Valuation Report is an in-depth analysis detailing your home's value as well as a comparison with similar homes in the area
Home Values in the Area
Average Home Value in this Area
Purchase History
| Date | Buyer | Sale Price | Title Company |
|---|---|---|---|
| Troy And Barbara Osborne Living Trust | -- | None Listed On Document | |
| Osborne Barbara J | -- | None Available | |
| Osborne Barbara T | -- | None Available | |
| Hobson Mitchell | -- | None Available |
Source: Public Records
Tax History
| Year | Tax Paid | Tax Assessment Tax Assessment Total Assessment is a certain percentage of the fair market value that is determined by local assessors to be the total taxable value of land and additions on the property. | Land | Improvement |
|---|---|---|---|---|
| 2025 | $1,559 | $144,936 | $24,430 | $120,506 |
| 2024 | $1,526 | $133,704 | $22,236 | $111,468 |
| 2023 | $1,784 | $122,658 | $22,236 | $100,422 |
| 2022 | $1,783 | $110,798 | $22,236 | $88,562 |
| 2021 | $1,648 | $101,309 | $22,236 | $79,073 |
| 2020 | $1,669 | $101,309 | $22,236 | $79,073 |
| 2019 | $1,421 | $87,218 | $22,172 | $65,046 |
| 2018 | $1,353 | $83,921 | $20,602 | $63,319 |
| 2017 | $1,323 | $98,822 | $19,656 | $79,166 |
| 2016 | $1,253 | $77,184 | $19,621 | $57,563 |
| 2015 | $1,273 | $77,184 | $19,621 | $57,563 |
| 2013 | $1,501 | $81,005 | $14,280 | $66,725 |
Source: Public Records
Map
Nearby Homes