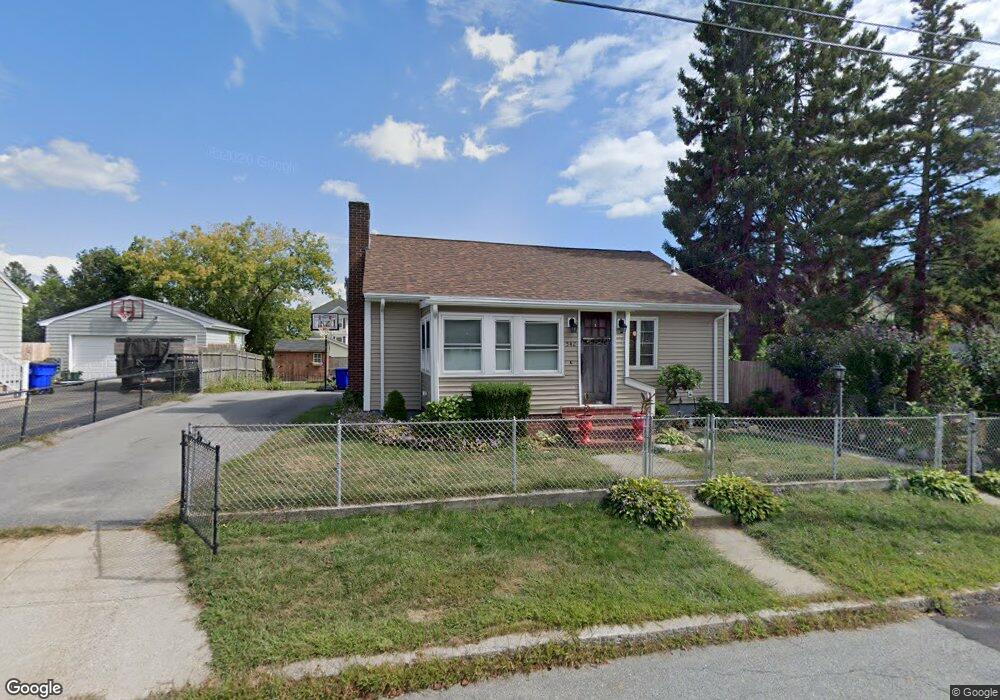
542 Smith St Fall River, MA 02721
Maplewood NeighborhoodEstimated Value: $283,000 - $407,000
2
Beds
1
Bath
896
Sq Ft
$382/Sq Ft
Est. Value
About This Home
This home is located at 542 Smith St, Fall River, MA 02721 and is currently estimated at $342,468, approximately $382 per square foot. 542 Smith St is a home located in Bristol County with nearby schools including Letourneau Elementary School, Talbot Innovation School, and B M C Durfee High School.
Ownership History
Date
Name
Owned For
Owner Type
Purchase Details
Closed on
Jun 23, 2011
Sold by
Walczyk Frederick W Es
Bought by
Bergantim Brian and Bergantim Isabel
Current Estimated Value
Home Financials for this Owner
Home Financials are based on the most recent Mortgage that was taken out on this home.
Original Mortgage
$100,000
Outstanding Balance
$68,938
Interest Rate
4.63%
Mortgage Type
Purchase Money Mortgage
Estimated Equity
$273,530
Purchase Details
Closed on
Apr 24, 2009
Sold by
Walczyk Theresa
Bought by
Walczyk Frederick W
Create a Home Valuation Report for This Property
The Home Valuation Report is an in-depth analysis detailing your home's value as well as a comparison with similar homes in the area
Home Values in the Area
Average Home Value in this Area
Purchase History
| Date | Buyer | Sale Price | Title Company |
|---|---|---|---|
| Bergantim Brian | $126,000 | -- | |
| Walczyk Frederick W | -- | -- |
Source: Public Records
Mortgage History
| Date | Status | Borrower | Loan Amount |
|---|---|---|---|
| Open | Bergantim Brian | $100,000 |
Source: Public Records
Tax History
| Year | Tax Paid | Tax Assessment Tax Assessment Total Assessment is a certain percentage of the fair market value that is determined by local assessors to be the total taxable value of land and additions on the property. | Land | Improvement |
|---|---|---|---|---|
| 2025 | $3,192 | $278,800 | $125,900 | $152,900 |
| 2024 | $2,999 | $261,000 | $121,100 | $139,900 |
| 2023 | $2,842 | $231,600 | $103,800 | $127,800 |
| 2022 | $2,456 | $194,600 | $94,400 | $100,200 |
| 2021 | $2,355 | $170,300 | $87,300 | $83,000 |
| 2020 | $2,285 | $158,100 | $83,600 | $74,500 |
| 2019 | $2,168 | $148,700 | $79,600 | $69,100 |
| 2018 | $2,094 | $143,200 | $78,100 | $65,100 |
| 2017 | $2,010 | $143,600 | $79,700 | $63,900 |
| 2016 | $1,959 | $143,700 | $83,000 | $60,700 |
| 2015 | $1,768 | $135,200 | $79,900 | $55,300 |
| 2014 | $1,754 | $139,400 | $84,100 | $55,300 |
Source: Public Records
Map
Nearby Homes
- 332 Albert St
- 213 Boyden St
- 545 Brayton Ave
- 1350 Rodman St
- 21 Boyden St
- 529 Stafford Rd
- 239 Glasgow St Unit 10
- 539 Aetna St
- 582 Cambridge St
- 10 Aberdeen St
- 59 Wayne St
- 40 Duncan St
- 495 Chicago St
- 304 Cambridge St
- 529 Warren St
- 248 Jefferson St
- 20 Reeves St
- 883 Grinnell St
- 889 Grinnell St Unit 2
- 889 Grinnell St Unit 7
Your Personal Tour Guide
Ask me questions while you tour the home.