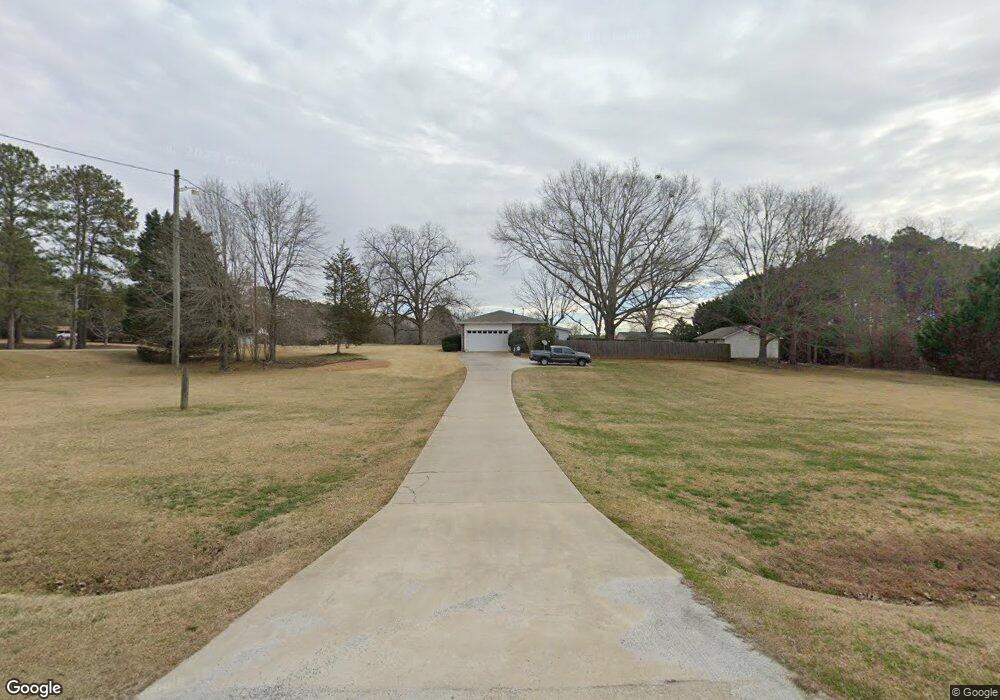
542 Swint Rd Griffin, GA 30224
Spalding County NeighborhoodEstimated Value: $220,000 - $254,000
3
Beds
2
Baths
1,467
Sq Ft
$164/Sq Ft
Est. Value
About This Home
This home is located at 542 Swint Rd, Griffin, GA 30224 and is currently estimated at $240,666, approximately $164 per square foot. 542 Swint Rd is a home located in Spalding County with nearby schools including Futral Road Elementary School, Rehoboth Road Middle School, and Spalding High School.
Ownership History
Date
Name
Owned For
Owner Type
Purchase Details
Closed on
Sep 12, 2002
Sold by
Boggus Anthhony W
Bought by
Boggus Carol E
Current Estimated Value
Home Financials for this Owner
Home Financials are based on the most recent Mortgage that was taken out on this home.
Original Mortgage
$98,500
Interest Rate
6.4%
Mortgage Type
New Conventional
Purchase Details
Closed on
Jan 31, 1996
Sold by
Hill Haskell H
Bought by
Goddard Sandra B
Purchase Details
Closed on
Jan 23, 1984
Sold by
Hodges Thomas
Bought by
Hill Christopher
Purchase Details
Closed on
Oct 19, 1977
Sold by
Jennings Michael E
Bought by
Hodges Thomas
Purchase Details
Closed on
Nov 30, 1972
Sold by
Meeks Ted
Bought by
Jennings Michael E
Purchase Details
Closed on
Sep 9, 1972
Sold by
Flintco Inc Etal
Bought by
Meeks Ted
Create a Home Valuation Report for This Property
The Home Valuation Report is an in-depth analysis detailing your home's value as well as a comparison with similar homes in the area
Home Values in the Area
Average Home Value in this Area
Purchase History
| Date | Buyer | Sale Price | Title Company |
|---|---|---|---|
| Boggus Carol E | -- | -- | |
| Goddard Sandra B | $43,250 | -- | |
| Hill Christopher | $50,000 | -- | |
| Hodges Thomas | $35,000 | -- | |
| Jennings Michael E | $28,500 | -- | |
| Meeks Ted | $4,000 | -- |
Source: Public Records
Mortgage History
| Date | Status | Borrower | Loan Amount |
|---|---|---|---|
| Closed | Boggus Carol E | $98,500 | |
| Closed | Goddard Sandra B | $0 |
Source: Public Records
Tax History Compared to Growth
Tax History
| Year | Tax Paid | Tax Assessment Tax Assessment Total Assessment is a certain percentage of the fair market value that is determined by local assessors to be the total taxable value of land and additions on the property. | Land | Improvement |
|---|---|---|---|---|
| 2024 | $2,622 | $75,089 | $12,866 | $62,223 |
| 2023 | $2,622 | $72,109 | $12,866 | $59,243 |
| 2022 | $2,259 | $63,940 | $11,352 | $52,588 |
| 2021 | $1,737 | $49,580 | $11,352 | $38,228 |
| 2020 | $1,342 | $38,575 | $10,320 | $28,255 |
| 2019 | $1,369 | $38,575 | $10,320 | $28,255 |
| 2018 | $1,312 | $36,155 | $10,320 | $25,835 |
| 2017 | $1,277 | $36,155 | $10,320 | $25,835 |
| 2016 | $1,300 | $36,155 | $10,320 | $25,835 |
| 2015 | $1,339 | $36,155 | $10,320 | $25,835 |
| 2014 | $1,366 | $36,155 | $10,320 | $25,835 |
Source: Public Records
Map
Nearby Homes
- 676 Lake Park North Dr
- 93 Green Acres Rd
- 1967 Futral Rd
- 1693 S Mcdonough Rd
- 2173 S Mcdonough Rd
- 1887 Green Valley Rd
- 1250 County Line Rd
- 331 Calhoun Rd
- 25 Quail Hollow Rd
- 3028 Sarah Ln
- 3020 Sarah Ln
- 275 Liberty Bell Ln
- 121 Sheldon Point
- 3045 Sarah Ln
- 3002 Sarah Ln
- 305 Liberty Bell Ln
- 3005 Sarah Ln
- 100 Glenview Dr
- 100 Liberty Bell Ln
- 108 Timber Ridge Dr
- 560 Swint Rd
- 560 Swint Rd Unit 2
- 23 Green Acres Rd
- 508 Swint Rd
- 525 Swint Rd
- 576 Swint Rd
- 571 Swint Rd
- 26 Green Acres Rd
- 506 Swint Rd
- 29 Green Acres Rd
- 483 Swint Rd
- 504 Swint Rd
- 35 Green Acres Rd
- 32 Green Acres Rd
- 614 Swint Rd
- 2245 S Walkers Mill Rd
- 2213 S Walkers Mill Rd
- 0 Lake Park Dr N Unit 7492197
- 664 Lake Park North Dr
- 2205 S Walkers Mill Rd