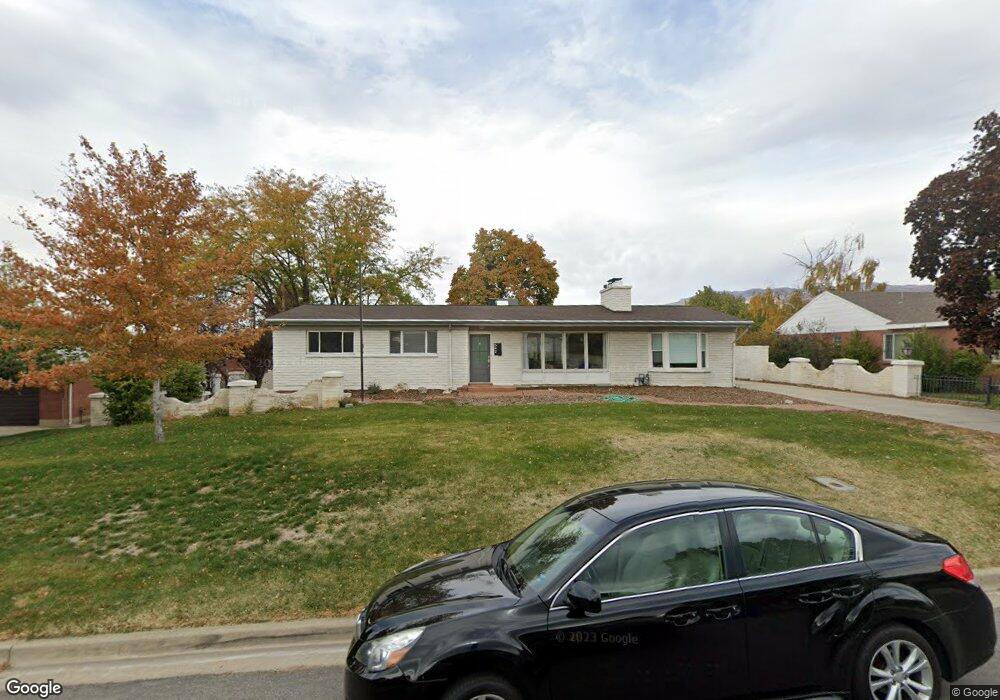
542 W 3000 S Bountiful, UT 84010
Estimated Value: $587,000 - $675,188
4
Beds
3
Baths
3,349
Sq Ft
$185/Sq Ft
Est. Value
About This Home
This home is located at 542 W 3000 S, Bountiful, UT 84010 and is currently estimated at $618,797, approximately $184 per square foot. 542 W 3000 S is a home located in Davis County with nearby schools including Adelaide School, South Davis Junior High School, and Woods Cross High School.
Ownership History
Date
Name
Owned For
Owner Type
Purchase Details
Closed on
Aug 8, 2022
Sold by
Brady and Jenny
Bought by
Moore Nathaniel and Berger Whitney
Current Estimated Value
Home Financials for this Owner
Home Financials are based on the most recent Mortgage that was taken out on this home.
Original Mortgage
$499,200
Outstanding Balance
$475,785
Interest Rate
5.3%
Mortgage Type
New Conventional
Estimated Equity
$143,012
Purchase Details
Closed on
Mar 20, 2017
Sold by
Sandberg Claudia Redd
Bought by
Brady Steven B and Brady Jenny
Purchase Details
Closed on
Dec 29, 2016
Sold by
Redd Trust
Bought by
Sandberg Claudia Redd
Purchase Details
Closed on
Jul 12, 2013
Sold by
Redd Kathleen H
Bought by
The Kathleen H Redd Trust and Redd Kathleen H
Purchase Details
Closed on
Sep 20, 2002
Sold by
Redd Kathleen H
Bought by
Redd L Wayne
Create a Home Valuation Report for This Property
The Home Valuation Report is an in-depth analysis detailing your home's value as well as a comparison with similar homes in the area
Home Values in the Area
Average Home Value in this Area
Purchase History
| Date | Buyer | Sale Price | Title Company |
|---|---|---|---|
| Moore Nathaniel | -- | North Star Title | |
| Brady Steven B | -- | First American Title | |
| Sandberg Claudia Redd | -- | First American Title | |
| The Kathleen H Redd Trust | -- | None Available | |
| Redd L Wayne | -- | -- |
Source: Public Records
Mortgage History
| Date | Status | Borrower | Loan Amount |
|---|---|---|---|
| Open | Moore Nathaniel | $499,200 |
Source: Public Records
Tax History Compared to Growth
Tax History
| Year | Tax Paid | Tax Assessment Tax Assessment Total Assessment is a certain percentage of the fair market value that is determined by local assessors to be the total taxable value of land and additions on the property. | Land | Improvement |
|---|---|---|---|---|
| 2025 | $3,643 | $329,450 | $182,983 | $146,467 |
| 2024 | $3,463 | $318,450 | $181,316 | $137,134 |
| 2023 | $3,342 | $554,000 | $316,046 | $237,954 |
| 2022 | $3,105 | $286,000 | $168,048 | $117,952 |
| 2021 | $2,882 | $407,000 | $220,640 | $186,360 |
| 2020 | $2,563 | $362,000 | $182,339 | $179,661 |
| 2019 | $2,541 | $355,000 | $155,596 | $199,404 |
| 2018 | $2,373 | $326,000 | $150,673 | $175,327 |
| 2016 | $1,880 | $150,260 | $70,107 | $80,153 |
| 2015 | $1,816 | $137,225 | $70,107 | $67,118 |
| 2014 | $1,757 | $135,843 | $70,107 | $65,736 |
| 2013 | -- | $124,320 | $49,446 | $74,874 |
Source: Public Records
Map
Nearby Homes
- 527 Applewood Dr
- 3183 S 500 W
- 2943 S 400 W
- 3238 S 675 W
- 757 W 3200 S
- 117 W 3000 S
- 298 Percival St Unit 354
- 259 Lionel St Unit 373
- 626 Sagramore St
- 785 Percival St
- 260 E 1100 N
- 260 E 1100 N Unit A14
- 310 N 675 E
- 246 Galahad St
- 246 Guenevere St Unit 81
- 562 Lancelot Dr Unit 60
- 3573 S Highway 89
- 167 Guenevere St Unit 128
- 2095 S Main St Unit 17
- 2095 S Main St Unit 23