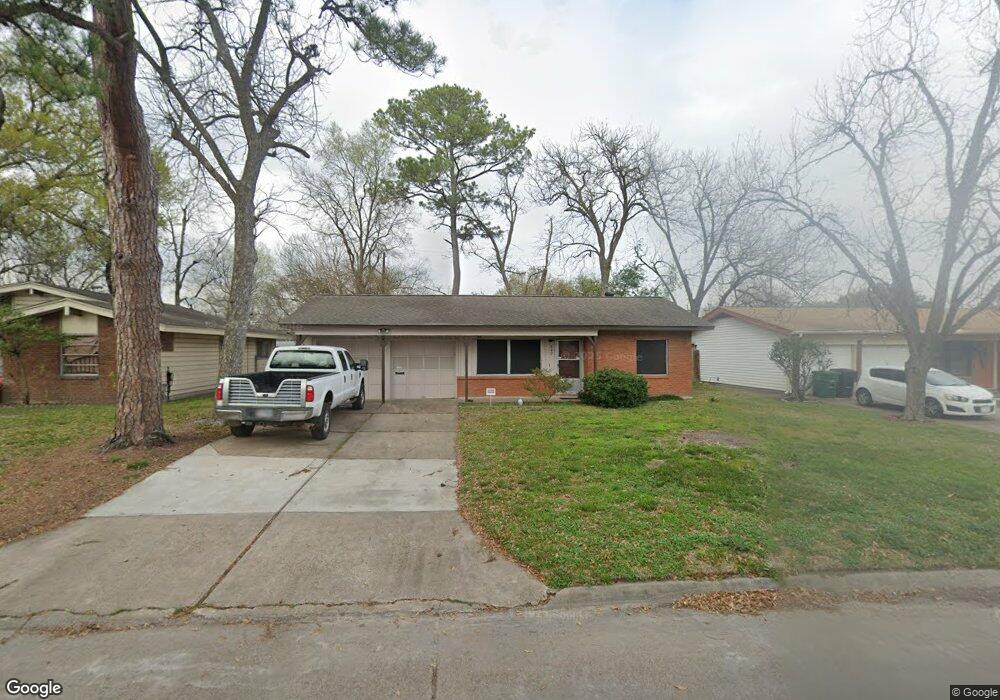
542 W Troy Rd Houston, TX 77091
Northside-Northline NeighborhoodEstimated Value: $198,000 - $209,000
3
Beds
1
Bath
1,174
Sq Ft
$173/Sq Ft
Est. Value
About This Home
This home is located at 542 W Troy Rd, Houston, TX 77091 and is currently estimated at $203,247, approximately $173 per square foot. 542 W Troy Rd is a home located in Harris County with nearby schools including Wesley Elementary School, Williams Middle, and Booker T Washington Sr High.
Ownership History
Date
Name
Owned For
Owner Type
Purchase Details
Closed on
Jul 30, 2009
Sold by
Thrash David C
Bought by
Thrash Deborah K
Current Estimated Value
Purchase Details
Closed on
Feb 8, 2008
Sold by
Spores Chris J and Spores Cara
Bought by
Thrash Deborah K
Home Financials for this Owner
Home Financials are based on the most recent Mortgage that was taken out on this home.
Original Mortgage
$74,000
Outstanding Balance
$46,896
Interest Rate
6.15%
Mortgage Type
Purchase Money Mortgage
Estimated Equity
$156,351
Purchase Details
Closed on
Jan 30, 2008
Sold by
Saenz Kathryn K
Bought by
Spores Chris J
Home Financials for this Owner
Home Financials are based on the most recent Mortgage that was taken out on this home.
Original Mortgage
$74,000
Outstanding Balance
$46,896
Interest Rate
6.15%
Mortgage Type
Purchase Money Mortgage
Estimated Equity
$156,351
Purchase Details
Closed on
May 17, 2005
Sold by
Spores Grace Evelyn
Bought by
Spores Chris J
Create a Home Valuation Report for This Property
The Home Valuation Report is an in-depth analysis detailing your home's value as well as a comparison with similar homes in the area
Home Values in the Area
Average Home Value in this Area
Purchase History
| Date | Buyer | Sale Price | Title Company |
|---|---|---|---|
| Thrash Deborah K | -- | None Available | |
| Thrash Deborah K | -- | Chicago Title | |
| Spores Chris J | -- | Chicago Title | |
| Spores Chris J | -- | Chicago Title |
Source: Public Records
Mortgage History
| Date | Status | Borrower | Loan Amount |
|---|---|---|---|
| Open | Thrash Deborah K | $74,000 |
Source: Public Records
Tax History Compared to Growth
Tax History
| Year | Tax Paid | Tax Assessment Tax Assessment Total Assessment is a certain percentage of the fair market value that is determined by local assessors to be the total taxable value of land and additions on the property. | Land | Improvement |
|---|---|---|---|---|
| 2025 | $2,963 | $198,906 | $71,920 | $126,986 |
| 2024 | $2,963 | $198,906 | $71,920 | $126,986 |
| 2023 | $2,963 | $185,815 | $71,920 | $113,895 |
| 2022 | $2,944 | $138,064 | $50,344 | $87,720 |
| 2021 | $2,833 | $134,560 | $50,344 | $84,216 |
| 2020 | $2,676 | $125,519 | $50,344 | $75,175 |
| 2019 | $2,542 | $114,911 | $35,960 | $78,951 |
| 2018 | $1,556 | $95,903 | $21,576 | $74,327 |
| 2017 | $2,099 | $83,024 | $21,576 | $61,448 |
| 2016 | $2,099 | $83,024 | $21,576 | $61,448 |
| 2015 | $1,537 | $83,024 | $21,576 | $61,448 |
| 2014 | $1,537 | $83,024 | $21,576 | $61,448 |
Source: Public Records
Map
Nearby Homes
- 6100 Stuebner Airline Rd
- 422 Surratt Dr
- 0 Pickering St
- 522 Surratt Dr
- 434 Yale Oaks Ln
- 427 Yale Oaks Ln
- 422 Yale Oaks Ln
- 406 Red Ripple Rd
- 6057 Yale St
- 410 Yale Oaks Ln
- 609 W Parker Rd
- 334 Yale Oaks Ln
- 327 Yale Oaks Ln
- 615 Northew St Unit J
- 615 Northew St Unit K
- 6315 N Shepherd Dr
- 0 Brinkman Unit 54849680
- 6105 Morrow St
- 5503 Beall St Unit A
- 5736 Stuebner Airline Rd