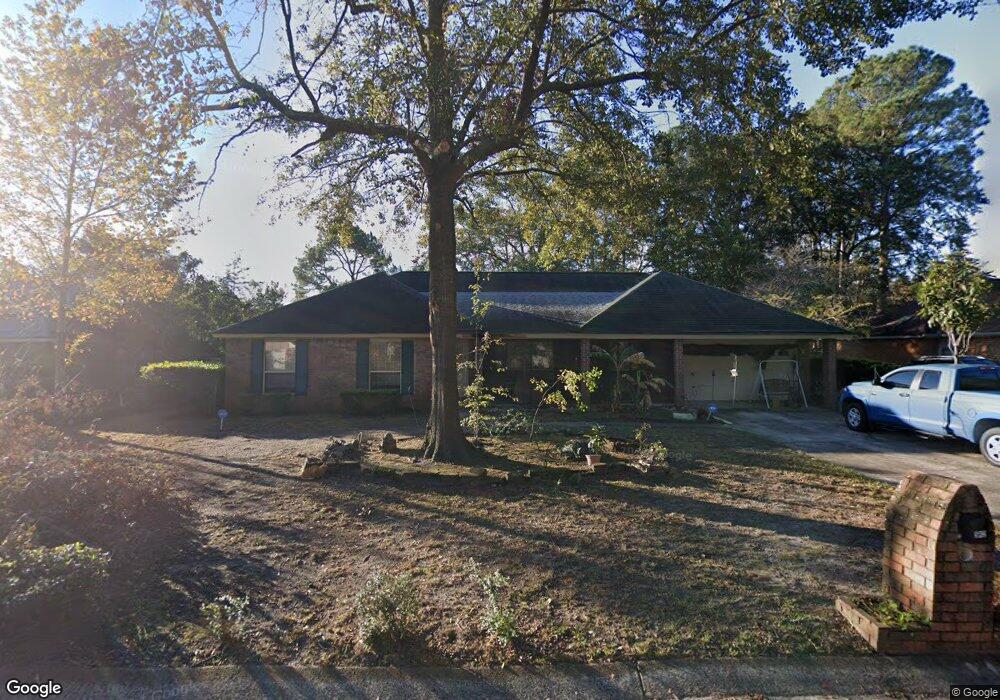
542 Wellington Way Hinesville, GA 31313
Estimated Value: $272,138 - $288,000
4
Beds
2
Baths
2,075
Sq Ft
$135/Sq Ft
Est. Value
About This Home
This home is located at 542 Wellington Way, Hinesville, GA 31313 and is currently estimated at $279,785, approximately $134 per square foot. 542 Wellington Way is a home located in Liberty County with nearby schools including Button Gwinnett Elementary School, Snelson-Golden Middle School, and Bradwell Institute.
Ownership History
Date
Name
Owned For
Owner Type
Purchase Details
Closed on
May 13, 2022
Sold by
Jackson Wayne Estate
Bought by
Jackson Lois
Current Estimated Value
Purchase Details
Closed on
Jul 14, 2006
Sold by
Bertrand Robert Scott
Bought by
Jackson Wayne and Jackson Lois R
Home Financials for this Owner
Home Financials are based on the most recent Mortgage that was taken out on this home.
Original Mortgage
$177,200
Interest Rate
6.6%
Mortgage Type
New Conventional
Purchase Details
Closed on
May 1, 2002
Sold by
Andrulewicz Mathias
Bought by
Bertrand Robert Scott and Bertrand Jacqueline
Purchase Details
Closed on
Feb 6, 1998
Sold by
Halisky Joseph Georg
Bought by
Andrulewicz Mathias
Purchase Details
Closed on
Aug 16, 1995
Bought by
Halisky Joseph Georg
Purchase Details
Closed on
Jun 15, 1994
Bought by
Stevens Glenn W
Purchase Details
Closed on
Aug 9, 1993
Bought by
Patterson Martin
Create a Home Valuation Report for This Property
The Home Valuation Report is an in-depth analysis detailing your home's value as well as a comparison with similar homes in the area
Home Values in the Area
Average Home Value in this Area
Purchase History
| Date | Buyer | Sale Price | Title Company |
|---|---|---|---|
| Jackson Lois | -- | -- | |
| Jackson Wayne | $173,500 | -- | |
| Bertrand Robert Scott | $135,000 | -- | |
| Andrulewicz Mathias | $122,100 | -- | |
| Halisky Joseph Georg | $122,500 | -- | |
| Stevens Glenn W | $119,000 | -- | |
| Patterson Martin | $113,800 | -- |
Source: Public Records
Mortgage History
| Date | Status | Borrower | Loan Amount |
|---|---|---|---|
| Previous Owner | Jackson Wayne | $177,200 |
Source: Public Records
Tax History Compared to Growth
Tax History
| Year | Tax Paid | Tax Assessment Tax Assessment Total Assessment is a certain percentage of the fair market value that is determined by local assessors to be the total taxable value of land and additions on the property. | Land | Improvement |
|---|---|---|---|---|
| 2024 | $23 | $103,136 | $14,000 | $89,136 |
| 2023 | $23 | $91,620 | $14,000 | $77,620 |
| 2022 | $22 | $77,037 | $14,000 | $63,037 |
| 2021 | $22 | $67,684 | $14,000 | $53,684 |
| 2020 | $21 | $61,670 | $12,800 | $48,870 |
| 2019 | $21 | $62,336 | $12,800 | $49,536 |
| 2018 | $21 | $63,003 | $12,800 | $50,203 |
| 2017 | $2,096 | $63,664 | $12,800 | $50,864 |
| 2016 | $21 | $64,325 | $12,800 | $51,525 |
| 2015 | $21 | $64,325 | $12,800 | $51,525 |
| 2014 | $21 | $59,150 | $12,800 | $46,350 |
| 2013 | -- | $75,430 | $14,000 | $61,430 |
Source: Public Records
Map
Nearby Homes
- 520 Wellington Way
- 201 Ash Blvd
- 489 Elm St
- 505 Franklin St
- 509 Franklin St
- 108 Cherrydale St
- 617 Oak St
- 125 Stafford St
- 615 Scott St
- 108 W General Screven Way
- 612 Olive St
- 0 County Line Rd Unit 1644022
- 0 County Line Rd Unit 18961791
- 614 Demere St
- 668 Windhaven Dr
- 104 Cedar St
- 617 Pineview Ct
- 480 Dykes St
- 544 Wellington Way
- 540 Wellington Way
- 524 Maxwelton Cir
- 522 Maxwelton Cir
- 528 Wellington Way
- 551 Brockington Cir
- 543 Wellington Way
- 541 Wellington Way
- 545 Wellington Way
- 553 Brockington Cir
- 526 Maxwelton Cir Unit 94
- 526 Maxwelton Cir
- 520 Maxwelton Cir
- 547 Wellington Way
- 555 Brockington Cir
- 539 Wellington Way
- 523 Maxwelton Cir
- 525 Maxwelton Cir
- 549 Wellington Way
- 537 Wellington Way