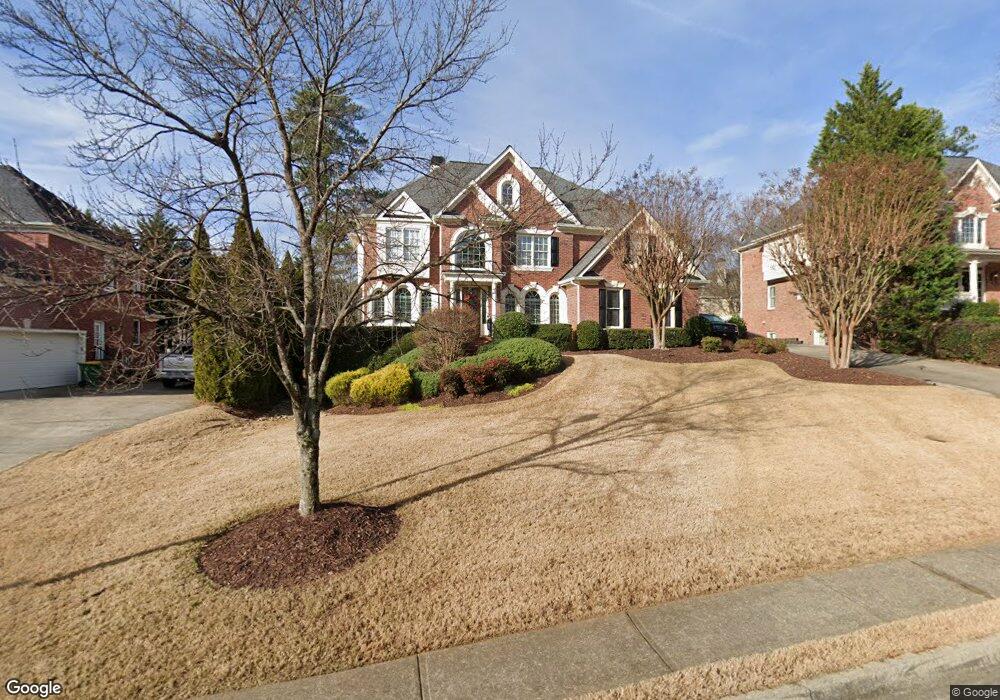
5420 Buck Hollow Dr Alpharetta, GA 30005
Estimated Value: $966,000 - $1,085,000
4
Beds
4
Baths
3,311
Sq Ft
$303/Sq Ft
Est. Value
About This Home
This home is located at 5420 Buck Hollow Dr, Alpharetta, GA 30005 and is currently estimated at $1,002,864, approximately $302 per square foot. 5420 Buck Hollow Dr is a home located in Forsyth County with nearby schools including Brookwood Elementary School, South Forsyth Middle School, and Lambert High School.
Ownership History
Date
Name
Owned For
Owner Type
Purchase Details
Closed on
Dec 26, 2006
Sold by
Weichert Relocation Resources
Bought by
Schuhr John L and Schuhr Beverly A
Current Estimated Value
Home Financials for this Owner
Home Financials are based on the most recent Mortgage that was taken out on this home.
Original Mortgage
$244,000
Outstanding Balance
$145,651
Interest Rate
6.19%
Mortgage Type
New Conventional
Estimated Equity
$857,213
Purchase Details
Closed on
Feb 20, 1998
Sold by
Peterson James D and Peterson Sharlyee K
Bought by
Torrey Michael S and Torrey Karla S
Home Financials for this Owner
Home Financials are based on the most recent Mortgage that was taken out on this home.
Original Mortgage
$258,000
Interest Rate
6.86%
Mortgage Type
New Conventional
Purchase Details
Closed on
Aug 22, 1996
Sold by
Osley Bldg Inc
Bought by
Peterson James Sharlyce K
Create a Home Valuation Report for This Property
The Home Valuation Report is an in-depth analysis detailing your home's value as well as a comparison with similar homes in the area
Home Values in the Area
Average Home Value in this Area
Purchase History
| Date | Buyer | Sale Price | Title Company |
|---|---|---|---|
| Schuhr John L | $494,000 | -- | |
| Weichert Relocation Resources | $494,000 | -- | |
| Torrey Michael S | $322,500 | -- | |
| Peterson James Sharlyce K | $304,700 | -- |
Source: Public Records
Mortgage History
| Date | Status | Borrower | Loan Amount |
|---|---|---|---|
| Open | Weichert Relocation Resources | $244,000 | |
| Previous Owner | Torrey Michael S | $258,000 | |
| Closed | Peterson James Sharlyce K | $0 |
Source: Public Records
Tax History Compared to Growth
Tax History
| Year | Tax Paid | Tax Assessment Tax Assessment Total Assessment is a certain percentage of the fair market value that is determined by local assessors to be the total taxable value of land and additions on the property. | Land | Improvement |
|---|---|---|---|---|
| 2025 | $1,203 | $418,676 | $78,000 | $340,676 |
| 2024 | $1,203 | $353,416 | $68,000 | $285,416 |
| 2023 | $1,145 | $348,632 | $60,000 | $288,632 |
| 2022 | $1,204 | $228,020 | $50,000 | $178,020 |
| 2021 | $1,158 | $228,020 | $50,000 | $178,020 |
| 2020 | $1,151 | $220,168 | $50,000 | $170,168 |
| 2019 | $1,131 | $190,132 | $50,000 | $140,132 |
| 2018 | $1,145 | $186,472 | $50,000 | $136,472 |
| 2017 | $1,149 | $176,088 | $40,000 | $136,088 |
| 2016 | $1,135 | $166,088 | $30,000 | $136,088 |
| 2015 | $1,135 | $166,088 | $30,000 | $136,088 |
| 2014 | $1,027 | $141,232 | $30,000 | $111,232 |
Source: Public Records
Map
Nearby Homes
- 4130 Millbrook Ct
- 3820 Ridge Point Dr
- 3845 Bridle Creek Dr
- 3415 Fox Hollow Way
- 4020 Bridle Ridge Dr
- 5105 Deerlake Dr
- 3730 Lakeheath Dr
- 7260 Fawn Lake Dr
- 3715 Lakeheath Dr
- 7170 Collingsworth Place
- 3150 Thistle Trail
- 4165 Hammond Bridge Dr
- 7335 Lytham Trace
- 3585 Lakeheath Dr
- 7045 Harlech Trace
- 4150 Cedar Bridge Walk
- 3910 Dalwood Dr
- 7530 Newstead Dr
- 3115 Arbor Song Ct
- 335 Pintail Ct
- 5410 Buck Hollow Dr
- 5430 Buck Hollow Dr
- 6315 Deerwoods Trail
- 6295 Deerwoods Trail
- 5440 Buck Hollow Dr
- 6285 Deerwoods Trail Unit IV
- 5435 Buck Hollow Dr Unit IV
- 6275 Deerwoods Trail
- 6325 Deerwoods Trail
- 5445 Buck Hollow Dr Unit 4
- 5425 Buck Hollow Dr
- 5450 Buck Hollow Dr
- 0 Deerwoods Trail Unit 7246907
- 0 Deerwoods Trail Unit 8775493
- 0 Deerwoods Trail Unit 8824610
- 5455 Buck Hollow Dr
- 6335 Deerwoods Trail Unit IV
- 5415 Buck Hollow Dr
- 5405 Buck Hollow Dr
- 5460 Buck Hollow Dr