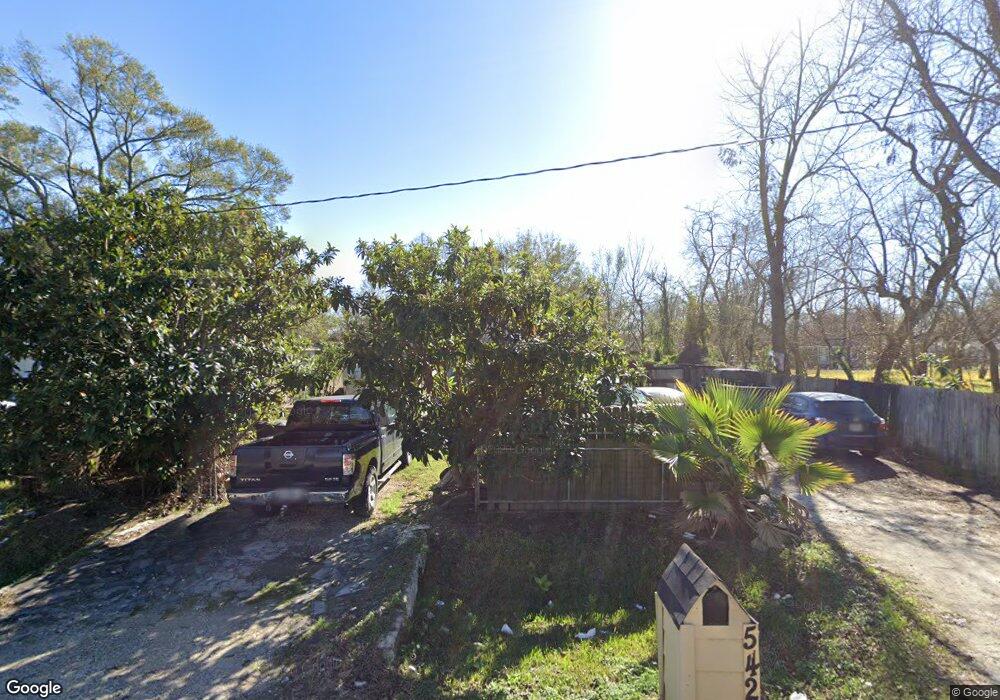
5420 Carey St Houston, TX 77028
Trinity-Houston Gardens NeighborhoodEstimated Value: $93,902 - $183,000
2
Beds
1
Bath
720
Sq Ft
$190/Sq Ft
Est. Value
About This Home
This home is located at 5420 Carey St, Houston, TX 77028 and is currently estimated at $136,476, approximately $189 per square foot. 5420 Carey St is a home located in Harris County with nearby schools including Felix Cook Jr. Elementary School, Key Middle, and Kashmere High School.
Ownership History
Date
Name
Owned For
Owner Type
Purchase Details
Closed on
Aug 29, 2018
Sold by
Texas Home Lot & Realty Company Llc
Bought by
Carranza Oscar Antonio Orellana and Orellana Carranza Ulises E
Current Estimated Value
Home Financials for this Owner
Home Financials are based on the most recent Mortgage that was taken out on this home.
Original Mortgage
$10,475
Interest Rate
4.5%
Mortgage Type
Purchase Money Mortgage
Purchase Details
Closed on
Oct 4, 2015
Sold by
Rodriguez Mauricio
Bought by
Orellana Carranza Josue De Jesus and Orellana Oscar Antonio
Purchase Details
Closed on
Feb 23, 2012
Sold by
Banegas Onella Michelle
Bought by
Rodriguez Mauricio
Purchase Details
Closed on
Feb 12, 2012
Sold by
Banegas Jose Manuel and Banegas Fernando
Bought by
Banegas Onelia Michelle
Purchase Details
Closed on
Feb 2, 1995
Sold by
Blaylock Alberta
Bought by
Banegas Fernando Lopez
Create a Home Valuation Report for This Property
The Home Valuation Report is an in-depth analysis detailing your home's value as well as a comparison with similar homes in the area
Home Values in the Area
Average Home Value in this Area
Purchase History
| Date | Buyer | Sale Price | Title Company |
|---|---|---|---|
| Carranza Oscar Antonio Orellana | -- | None Available | |
| Orellana Carranza Josue De Jesus | -- | None Available | |
| Rodriguez Mauricio | -- | None Available | |
| Banegas Onelia Michelle | -- | None Available | |
| Banegas Fernando Lopez | -- | -- |
Source: Public Records
Mortgage History
| Date | Status | Borrower | Loan Amount |
|---|---|---|---|
| Closed | Carranza Oscar Antonio Orellana | $10,475 |
Source: Public Records
Tax History Compared to Growth
Tax History
| Year | Tax Paid | Tax Assessment Tax Assessment Total Assessment is a certain percentage of the fair market value that is determined by local assessors to be the total taxable value of land and additions on the property. | Land | Improvement |
|---|---|---|---|---|
| 2025 | $1,406 | $70,615 | $47,850 | $22,765 |
| 2024 | $1,406 | $68,999 | $47,850 | $21,149 |
| 2023 | $1,406 | $56,007 | $34,590 | $21,417 |
| 2022 | $1,005 | $45,626 | $28,825 | $16,801 |
| 2021 | $829 | $35,576 | $21,619 | $13,957 |
| 2020 | $623 | $25,715 | $13,260 | $12,455 |
| 2019 | $616 | $24,360 | $12,107 | $12,253 |
| 2018 | $501 | $19,791 | $10,377 | $9,414 |
| 2017 | $500 | $19,791 | $10,377 | $9,414 |
| 2016 | $500 | $19,791 | $10,377 | $9,414 |
| 2015 | $509 | $19,791 | $8,648 | $11,143 |
| 2014 | $509 | $19,791 | $8,648 | $11,143 |
Source: Public Records
Map
Nearby Homes
- 5409-5417 Carey St
- 6713 Hoffman St
- 6713 Shotwell St
- 6112 Shotwell St
- 5420 Lynnfield St Unit A/B
- 0 Lynnfield St
- 00 Lynnfield St
- 0 Peachtree St Unit 21922779
- 0 Peachtree St Unit 3094206
- 0 Peachtree St Unit 19233458
- 0 Sandra St Unit 33902265
- 7312 Wileyvale Rd Unit B
- 7312 Wileyvale Rd Unit D
- 7312 Wileyvale Rd Unit E
- 7312 Wileyvale Rd Unit C
- 7312 Wileyvale Rd Unit A
- 6520 Hoffman St
- 6701 Mariosa St
- 7311 Wileyvale Rd Unit A
- 7311 Wileyvale Rd Unit B
- 7011 Hoffman St
- 7003 Hoffman St
- 7003 Hoffman St Unit A
- 7003 Hoffman St Unit b
- 7014 Shotwell St
- 7010 Shotwell St
- 7101 Hoffman St
- 6929 Hoffman St
- 7104 Shotwell St
- 6928 Shotwell St
- 6925 Hoffman St
- 6924 Shotwell St
- 7107 Hoffman St
- 7014 Hoffman St
- 7110 Shotwell St
- 7012 Hoffman St
- 6915 Hoffman St
- 7006 Hoffman St
- 6920 Shotwell St
- 7102 Hoffman St