5420 Mulberry Preserve Dr Flowery Branch, GA 30542
Estimated Value: $434,000 - $480,000
3
Beds
3
Baths
2,570
Sq Ft
$173/Sq Ft
Est. Value
About This Home
This home is located at 5420 Mulberry Preserve Dr, Flowery Branch, GA 30542 and is currently estimated at $445,772, approximately $173 per square foot. 5420 Mulberry Preserve Dr is a home located in Hall County with nearby schools including Spout Springs Elementary School, Cherokee Bluff Middle School, and Cherokee Bluff High School.
Ownership History
Date
Name
Owned For
Owner Type
Purchase Details
Closed on
Sep 6, 2019
Sold by
Phillips Samuel Mark
Bought by
Farmer Mary and Farmer Shane
Current Estimated Value
Home Financials for this Owner
Home Financials are based on the most recent Mortgage that was taken out on this home.
Original Mortgage
$212,000
Outstanding Balance
$185,696
Interest Rate
3.6%
Mortgage Type
New Conventional
Estimated Equity
$260,076
Purchase Details
Closed on
Feb 7, 2011
Sold by
Curnow Robert E
Bought by
Phillips Samuel M and Phillips Katherine J
Home Financials for this Owner
Home Financials are based on the most recent Mortgage that was taken out on this home.
Original Mortgage
$112,000
Interest Rate
4.79%
Mortgage Type
New Conventional
Purchase Details
Closed on
Nov 29, 2006
Sold by
White Horse At The Preserves L
Bought by
Curnow Robert Edward
Home Financials for this Owner
Home Financials are based on the most recent Mortgage that was taken out on this home.
Original Mortgage
$164,000
Interest Rate
6.33%
Mortgage Type
New Conventional
Purchase Details
Closed on
Apr 15, 2005
Sold by
Little River Homes Inc
Bought by
Parker Chandler Homes Inc
Create a Home Valuation Report for This Property
The Home Valuation Report is an in-depth analysis detailing your home's value as well as a comparison with similar homes in the area
Home Values in the Area
Average Home Value in this Area
Purchase History
| Date | Buyer | Sale Price | Title Company |
|---|---|---|---|
| Farmer Mary | $265,000 | -- | |
| Phillips Samuel M | $140,000 | -- | |
| Curnow Robert Edward | $205,000 | -- | |
| Parker Chandler Homes Inc | $697,500 | -- |
Source: Public Records
Mortgage History
| Date | Status | Borrower | Loan Amount |
|---|---|---|---|
| Open | Farmer Mary | $212,000 | |
| Previous Owner | Phillips Samuel M | $112,000 | |
| Previous Owner | Curnow Robert Edward | $164,000 |
Source: Public Records
Tax History Compared to Growth
Tax History
| Year | Tax Paid | Tax Assessment Tax Assessment Total Assessment is a certain percentage of the fair market value that is determined by local assessors to be the total taxable value of land and additions on the property. | Land | Improvement |
|---|---|---|---|---|
| 2024 | $4,260 | $165,040 | $27,080 | $137,960 |
| 2023 | $3,932 | $151,720 | $27,080 | $124,640 |
| 2022 | $3,424 | $125,920 | $26,360 | $99,560 |
| 2021 | $3,270 | $117,680 | $20,680 | $97,000 |
| 2020 | $2,973 | $103,280 | $14,040 | $89,240 |
| 2019 | $2,838 | $97,440 | $14,040 | $83,400 |
| 2018 | $2,828 | $93,920 | $14,480 | $79,440 |
| 2017 | $2,693 | $90,160 | $12,920 | $77,240 |
| 2016 | $2,402 | $81,720 | $11,360 | $70,360 |
| 2015 | $1,778 | $72,840 | $11,360 | $61,480 |
| 2014 | $1,778 | $58,428 | $9,080 | $49,348 |
Source: Public Records
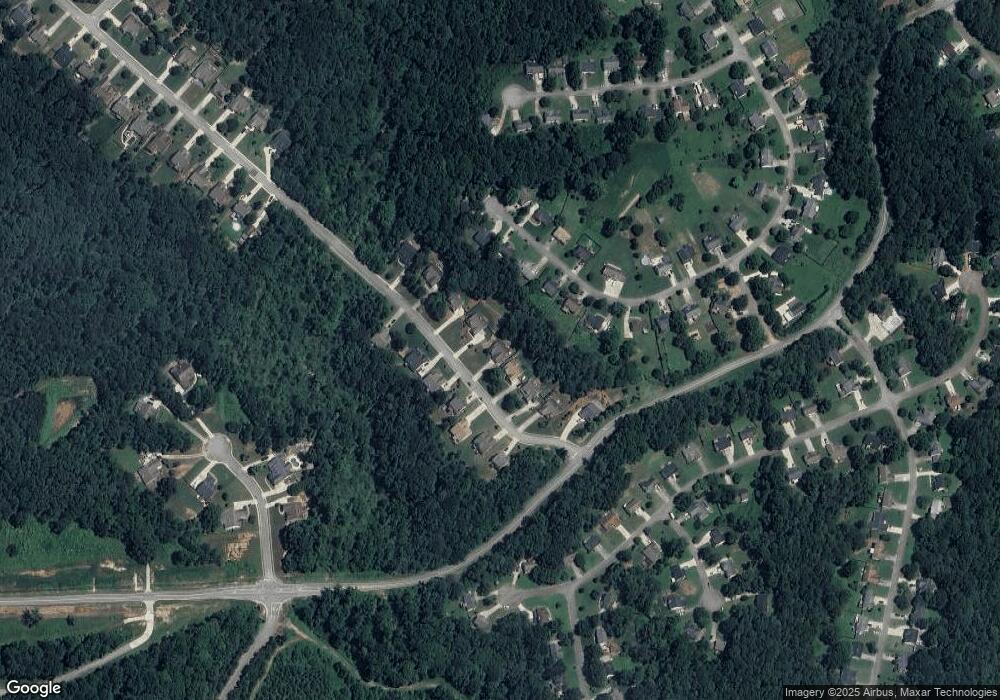
Map
Nearby Homes
- 5505 Riverchase Dr
- 5536 Rolling Mist Ct
- 5540 Rolling Mist Ct
- 5526 Chestnut Creek Ln
- 5325 Highpoint Rd
- 5268 Bowman Springs Trail
- 5610 Wooded Valley Way
- 5641 Wooded Valley Way
- 5126 Cash Rd
- 6410 Crosscreek Ln
- 6722 Blue Heron Way
- 5181 Cash Rd
- 5157 Glen Forrest Dr
- 5129 Glen Forrest Dr
- 6315 Spout Springs Rd
- 6844 Golden Bud Ln
- 6469 Crosscreek Ln
- 6763 Big Sky Dr
- 5523 River Valley Way
- 5416 Mulberry Preserve Dr
- 5424 Mulberry Preserve Dr
- 5412 Mulberry Preserve Dr
- 5428 Mulberry Preserve Dr
- 5489 Riverchase Dr
- 5491 Riverchase Dr
- 5493 Riverchase Dr
- 5421 Mulberry Preserve Dr Unit 109
- 5421 Mulberry Preserve Dr Unit 68
- 5421 Mulberry Preserve Dr
- 5425 Mulberry Preserve Dr
- 5408 Mulberry Preserve Dr Unit 2
- 5408 Mulberry Preserve Dr
- 5497 Riverchase Dr
- 5432 Mulberry Preserve Dr
- 5483 Riverchase Dr
- 5417 Mulberry Preserve Dr
- 5429 Mulberry Preserve Dr
- 5404 Mulberry Preserve Dr
- 5433 Mulberry Preserve Dr