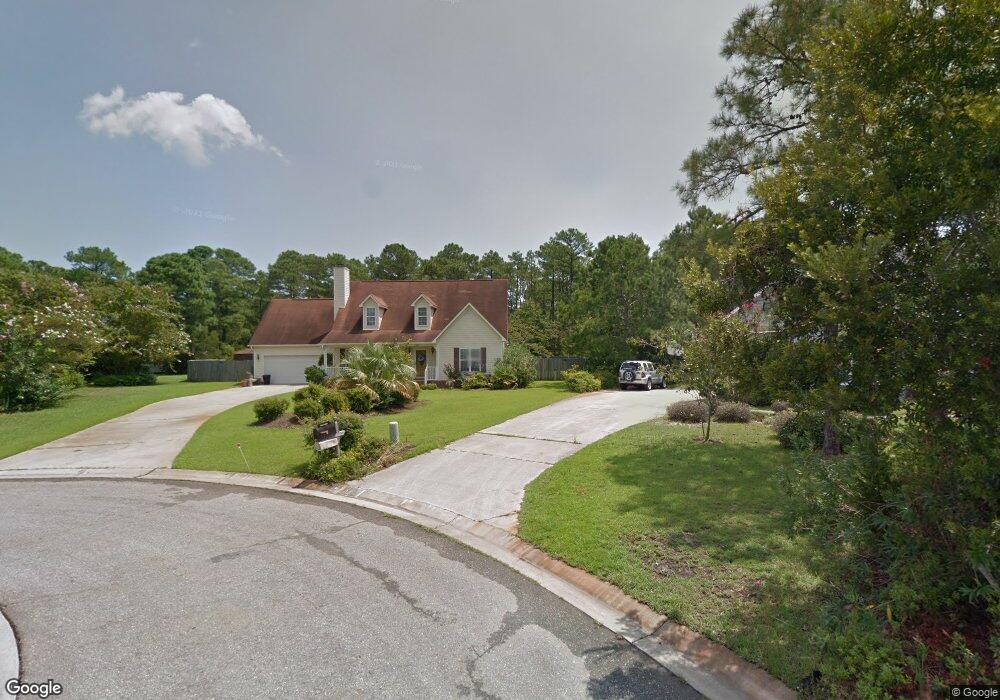
5421 Beretta Way Wilmington, NC 28409
Masonboro NeighborhoodEstimated Value: $487,000 - $562,000
3
Beds
3
Baths
2,125
Sq Ft
$244/Sq Ft
Est. Value
About This Home
This home is located at 5421 Beretta Way, Wilmington, NC 28409 and is currently estimated at $518,549, approximately $244 per square foot. 5421 Beretta Way is a home located in New Hanover County with nearby schools including Masonboro Elementary School, Roland-Grise Middle School, and John T. Hoggard High School.
Ownership History
Date
Name
Owned For
Owner Type
Purchase Details
Closed on
Feb 27, 2015
Sold by
Blackham Robert Crawfrod and Blackham Jeanne P
Bought by
Blackham Jeanne P
Current Estimated Value
Purchase Details
Closed on
Oct 12, 2005
Sold by
Blackham Jeanne P
Bought by
Blackham Robert Crawford
Purchase Details
Closed on
Aug 7, 1998
Sold by
Bishop Douglas M Jana C
Bought by
Blackham Jeanne P
Purchase Details
Closed on
Oct 4, 1996
Sold by
Croom Rodney B Jean B
Bought by
Bishop Douglas M Jana C
Purchase Details
Closed on
Apr 29, 1994
Sold by
Stevens Building Company Inc
Bought by
Croom Rodney B Jean B
Purchase Details
Closed on
Feb 22, 1994
Sold by
Stevens William E Cora Sue
Bought by
Stevens Building Company Inc
Purchase Details
Closed on
Feb 18, 1993
Sold by
Saffo Turner Corp
Bought by
Stevens William E
Purchase Details
Closed on
May 1, 1988
Sold by
Masonboro Properties
Bought by
Saffo Turner Corp
Create a Home Valuation Report for This Property
The Home Valuation Report is an in-depth analysis detailing your home's value as well as a comparison with similar homes in the area
Home Values in the Area
Average Home Value in this Area
Purchase History
| Date | Buyer | Sale Price | Title Company |
|---|---|---|---|
| Blackham Jeanne P | -- | None Available | |
| Blackham Robert Crawford | -- | None Available | |
| Blackham Jeanne P | $160,000 | -- | |
| Bishop Douglas M Jana C | $155,000 | -- | |
| Croom Rodney B Jean B | $131,500 | -- | |
| Stevens Building Company Inc | $22,000 | -- | |
| Stevens William E | $42,500 | -- | |
| Saffo Turner Corp | -- | -- |
Source: Public Records
Tax History Compared to Growth
Tax History
| Year | Tax Paid | Tax Assessment Tax Assessment Total Assessment is a certain percentage of the fair market value that is determined by local assessors to be the total taxable value of land and additions on the property. | Land | Improvement |
|---|---|---|---|---|
| 2025 | -- | $509,800 | $134,400 | $375,400 |
| 2023 | -- | $320,900 | $90,300 | $230,600 |
| 2022 | $0 | $320,900 | $90,300 | $230,600 |
| 2021 | $1,199 | $320,900 | $90,300 | $230,600 |
| 2020 | $1,199 | $227,600 | $62,200 | $165,400 |
| 2019 | $1,199 | $227,600 | $62,200 | $165,400 |
| 2018 | $0 | $227,600 | $62,200 | $165,400 |
| 2017 | $1,199 | $227,600 | $62,200 | $165,400 |
| 2016 | $1,230 | $222,100 | $62,200 | $159,900 |
| 2015 | $2,352 | $222,100 | $62,200 | $159,900 |
| 2014 | $2,252 | $222,100 | $62,200 | $159,900 |
Source: Public Records
Map
Nearby Homes
- 110 Cabbage Inlet Ln
- 609 Mason Knoll Ct
- 300 Cabbage Inlet Ln
- 4100 Purviance Ct
- 5419 Dunmore Rd
- 5415 Dunmore Rd
- 1017 Sabal Dr
- 3239 Kellerton Place
- 1008 Sabal Ct
- 3403 Kildare Place
- 4204 Purviance Ct
- 3250 Kellerton Place
- 3863 Daphine Ct
- 5101 Avine Ct
- 3217 Sunset Bend Ct Unit 144
- 439 Kelly Rd
- 4315 Cranesbill Ct
- 5016 Treybrooke Dr
- 3305 Shelter Sound Ct
- 3309 Shelter Sound Ct
- 5419 Beretta Way
- 5422 Beretta Way
- 5417 Beretta Way
- 5420 Beretta Way
- 5416 Beretta Way
- 3508 Cordgrass Ln
- 5413 Beretta Way
- 7834 Masonboro Sound Rd
- 3512 Cordgrass Ln
- 3712 Needle Sound Way
- 3718 Needle Sound Way
- 3516 Cordgrass Ln
- 5412 Beretta Way
- 3708 Needle Sound Way
- 7830 Masonboro Sound Rd
- 5409 Beretta Way
- 3520 Cordgrass Ln
- 5408 Beretta Way
- 7924 Masonboro Sound Rd
- 7826 Masonboro Sound Rd