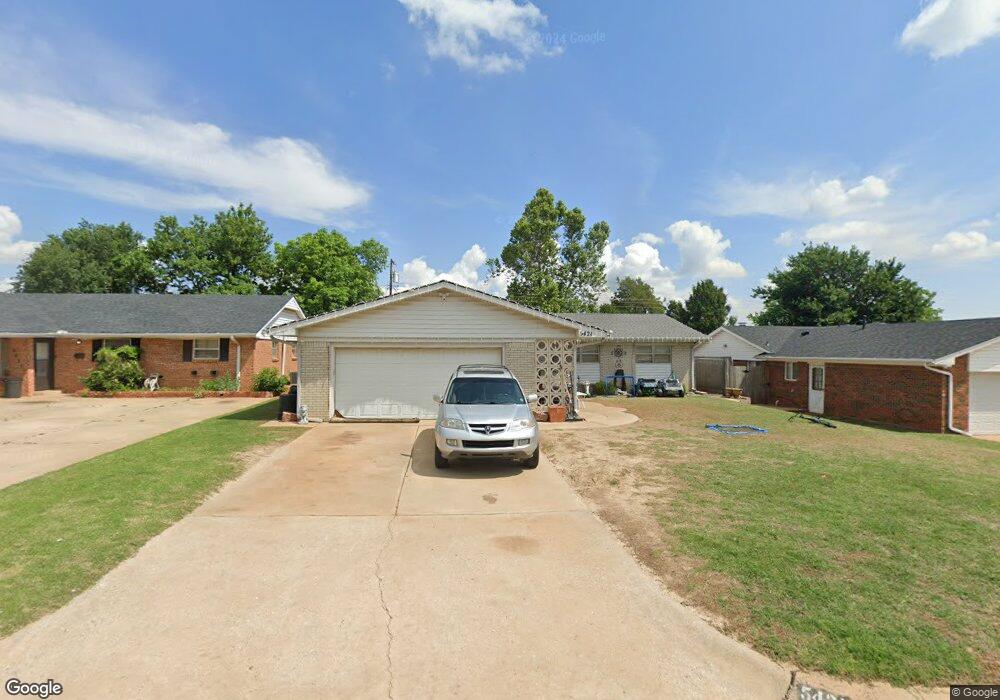
5421 NW 64th St Warr Acres, OK 73132
Estimated Value: $226,000 - $261,000
3
Beds
3
Baths
2,376
Sq Ft
$104/Sq Ft
Est. Value
About This Home
This home is located at 5421 NW 64th St, Warr Acres, OK 73132 and is currently estimated at $246,268, approximately $103 per square foot. 5421 NW 64th St is a home located in Oklahoma County with nearby schools including Rollingwood Elementary School, James L. Capps Middle School, and Putnam City High School.
Ownership History
Date
Name
Owned For
Owner Type
Purchase Details
Closed on
Oct 3, 2021
Sold by
Rosette Zena
Bought by
Cash Raymond Darrell and Cash Ray
Current Estimated Value
Purchase Details
Closed on
Oct 30, 2020
Sold by
Cash Zena Rosette
Bought by
Cash Raymond Darrell
Purchase Details
Closed on
Sep 21, 2012
Sold by
Lee Bryan Keith
Bought by
Cash Ray and Cash Zena
Home Financials for this Owner
Home Financials are based on the most recent Mortgage that was taken out on this home.
Original Mortgage
$155,000
Interest Rate
3.66%
Mortgage Type
Future Advance Clause Open End Mortgage
Purchase Details
Closed on
Jan 18, 2010
Sold by
Rak Investments Inc
Bought by
Lee Bryan Keith
Purchase Details
Closed on
Dec 7, 2009
Sold by
West Joanna C and West Edward M
Bought by
Rak Investments Inc
Purchase Details
Closed on
Jun 26, 2009
Sold by
Tillinghast Judith Anna
Bought by
West Joanna
Create a Home Valuation Report for This Property
The Home Valuation Report is an in-depth analysis detailing your home's value as well as a comparison with similar homes in the area
Home Values in the Area
Average Home Value in this Area
Purchase History
| Date | Buyer | Sale Price | Title Company |
|---|---|---|---|
| Cash Raymond Darrell | -- | None Available | |
| Cash Raymond Darrell | -- | None Available | |
| Cash Ray | $155,000 | Stewart Abstract & Title Of | |
| Lee Bryan Keith | $96,000 | Trustmark Title | |
| Rak Investments Inc | $75,000 | None Available | |
| West Joanna | -- | None Available |
Source: Public Records
Mortgage History
| Date | Status | Borrower | Loan Amount |
|---|---|---|---|
| Previous Owner | Cash Ray | $155,000 |
Source: Public Records
Tax History Compared to Growth
Tax History
| Year | Tax Paid | Tax Assessment Tax Assessment Total Assessment is a certain percentage of the fair market value that is determined by local assessors to be the total taxable value of land and additions on the property. | Land | Improvement |
|---|---|---|---|---|
| 2024 | $1,435 | $13,573 | $1,818 | $11,755 |
| 2023 | $1,435 | $13,178 | $1,381 | $11,797 |
| 2022 | $1,420 | $12,793 | $1,529 | $11,264 |
| 2021 | $1,368 | $12,421 | $1,713 | $10,708 |
| 2020 | $1,328 | $12,060 | $1,770 | $10,290 |
| 2019 | $1,276 | $11,709 | $1,602 | $10,107 |
| 2018 | $1,084 | $11,369 | $0 | $0 |
| 2017 | $1,054 | $11,036 | $1,619 | $9,417 |
| 2016 | $1,022 | $10,715 | $1,654 | $9,061 |
| 2015 | $995 | $10,403 | $1,581 | $8,822 |
| 2014 | $923 | $10,100 | $2,216 | $7,884 |
Source: Public Records
Map
Nearby Homes
- 5421 NW 65th St
- 5512 NW 64th St
- 5408 NW 67th St
- 5709 NW 64th St
- 5609 NW 67th St
- 7020 Cherokee Crossing E
- 7061 Hidden Trail Ln
- 6309 NW 62nd Cir
- 6425 N Harvard Ave
- 6308 NW 62nd Cir
- 5932 N Grove Ave
- 4612 NW 62nd St
- 4632 NW 60th St
- 4637 NW 70th St
- 5636 NW 58th Terrace
- 6554 N Meridian Ave Unit 210
- 6724 N Meridian Ave Unit C
- 5800 N Meridian Place
- 4401 NW 60th St
- 6005 NW 58th Terrace
- 5425 NW 64th St
- 5417 NW 64th St
- 5429 NW 64th St
- 5420 NW 65th St
- 5413 NW 64th St
- 5420 NW 5420 St
- 5424 NW 65th St
- 5416 NW 65th St
- 5428 NW 65th St
- 5420 NW 64th St
- 5501 NW 64th St
- 5416 NW 64th St
- 5424 NW 64th St
- 5412 NW 64th St
- 5500 NW 65th St
- 5428 NW 64th St
- 5408 NW 65th St
- 5505 NW 64th St
- 5405 NW 64th St
- 5408 NW 64th St