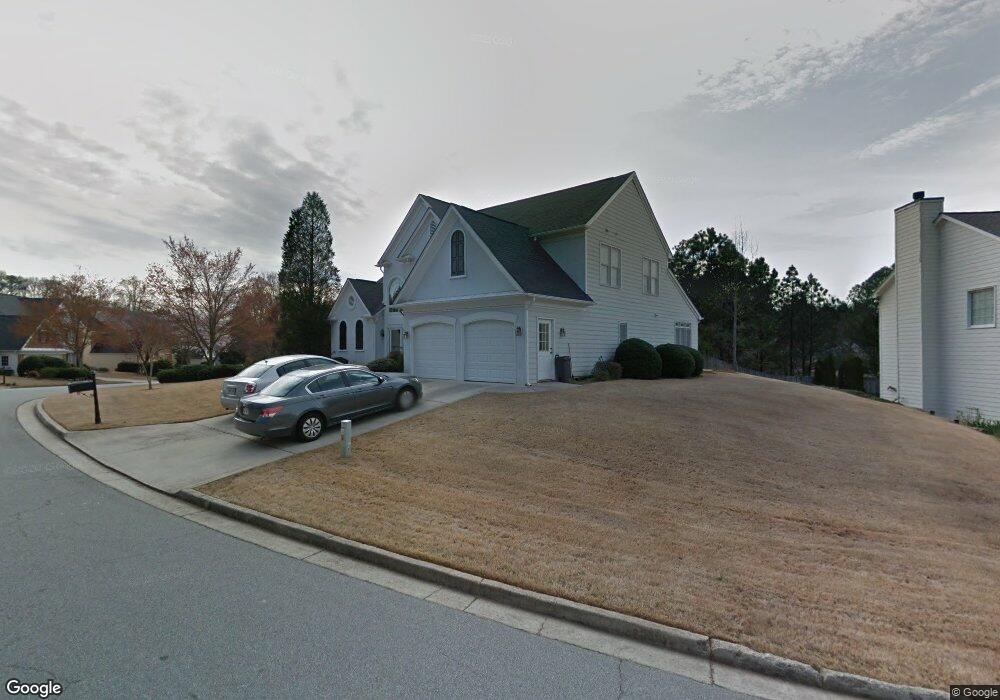
5422 Oxford Chase Way Atlanta, GA 30338
Estimated Value: $696,279 - $802,000
4
Beds
3
Baths
2,670
Sq Ft
$286/Sq Ft
Est. Value
About This Home
This home is located at 5422 Oxford Chase Way, Atlanta, GA 30338 and is currently estimated at $764,320, approximately $286 per square foot. 5422 Oxford Chase Way is a home located in DeKalb County with nearby schools including Vanderlyn Elementary School, Peachtree Middle School, and Dunwoody High School.
Ownership History
Date
Name
Owned For
Owner Type
Purchase Details
Closed on
May 1, 2022
Sold by
Lee Yuk Ying
Bought by
Chan Alan Chung Tak
Current Estimated Value
Purchase Details
Closed on
Mar 27, 2018
Sold by
Chan Alan Chung Tak
Bought by
Chan Alan Chung Tak and Chan Yuk Ying
Home Financials for this Owner
Home Financials are based on the most recent Mortgage that was taken out on this home.
Original Mortgage
$294,000
Interest Rate
4.43%
Mortgage Type
New Conventional
Purchase Details
Closed on
Jan 27, 2009
Sold by
Chan Yuet T L
Bought by
Chan Alan C T
Purchase Details
Closed on
Jan 18, 2005
Sold by
Chan Alan C
Bought by
Chan Yuet Yek
Purchase Details
Closed on
Mar 3, 2004
Sold by
Chan Yuet Y L
Bought by
Chan Alan C T
Purchase Details
Closed on
Feb 28, 1995
Sold by
Pulte Home Corp
Bought by
Chan Alan C Yuet Y
Create a Home Valuation Report for This Property
The Home Valuation Report is an in-depth analysis detailing your home's value as well as a comparison with similar homes in the area
Home Values in the Area
Average Home Value in this Area
Purchase History
| Date | Buyer | Sale Price | Title Company |
|---|---|---|---|
| Chan Alan Chung Tak | -- | -- | |
| Chan Alan Chung Tak | -- | -- | |
| Chan Alan C T | $140,000 | -- | |
| Chan Yuet Yek | $40,000 | -- | |
| Chan Alan C T | $40,000 | -- | |
| Chan Alan C Yuet Y | $223,000 | -- |
Source: Public Records
Mortgage History
| Date | Status | Borrower | Loan Amount |
|---|---|---|---|
| Previous Owner | Chan Alan Chung Tak | $294,000 | |
| Closed | Chan Alan C Yuet Y | $0 |
Source: Public Records
Tax History Compared to Growth
Tax History
| Year | Tax Paid | Tax Assessment Tax Assessment Total Assessment is a certain percentage of the fair market value that is determined by local assessors to be the total taxable value of land and additions on the property. | Land | Improvement |
|---|---|---|---|---|
| 2024 | $1,348 | $227,280 | $60,000 | $167,280 |
| 2023 | $1,348 | $230,960 | $60,000 | $170,960 |
| 2022 | $6,078 | $217,360 | $60,000 | $157,360 |
| 2021 | $5,340 | $188,920 | $60,000 | $128,920 |
| 2020 | $5,480 | $189,600 | $60,000 | $129,600 |
| 2019 | $5,227 | $182,960 | $60,000 | $122,960 |
| 2018 | $5,030 | $173,000 | $60,000 | $113,000 |
| 2017 | $5,541 | $167,480 | $51,880 | $115,600 |
| 2016 | $5,069 | $157,840 | $51,880 | $105,960 |
| 2014 | $4,705 | $143,560 | $51,880 | $91,680 |
Source: Public Records
Map
Nearby Homes
- 1933 Rotherham Way
- 5437 Oxford Chase Way
- 5383 Trentham Dr
- 5379 Trentham Dr
- 5377 Trentham Dr
- 5417 Trentham Dr
- 1960 Clairborne Ct
- 1983 Wellesley Trace
- 1971 Wellesley Trace
- 1959 Clairborne Ct
- 5427 Trentham Dr
- 5436 Trentham Dr
- 4101 Dunwoody Club Dr Unit 49
- 5212 Falkirk Dr
- 5401 Seaton Way
- 5513 N Peachtree Rd
- 7410 Chestwick Ct
- 5271 Vernon Lake Dr
- 5410 Oxford Chase Way Unit 3
- 5421 Oxford Chase Way
- 5440 Oxford Chase Way
- 5404 Oxford Chase Way
- 1945 Winterbourne Ct
- 5413 Oxford Chase Way
- 5425 Oxford Chase Way Unit IV
- 1949 Winterbourne Ct
- 5431 Oxford Chase Way
- 5417 Oxford Chase Way
- 5407 Oxford Chase Way Unit 3
- 5398 Oxford Chase Way Unit 3
- 5401 Oxford Chase Way
- 5538 Oxford Chase Way
- 5532 Oxford Chase Way
- 5443 Oxford Chase Way Unit IV
- 1964 Rotherham Way
- 5452 Oxford Chase Way Unit 4
- 1958 Rotherham Way Unit 2
- 1950 Winterbourne Ct Unit IV