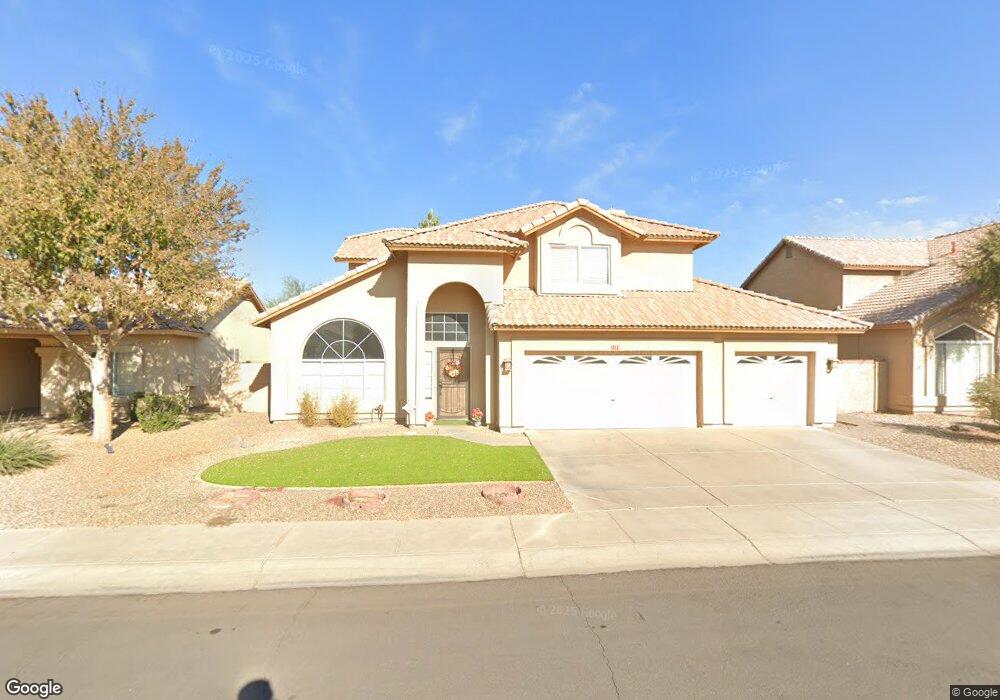
5422 W Elgin St Chandler, AZ 85226
West Chandler NeighborhoodEstimated Value: $546,515 - $630,000
3
Beds
3
Baths
2,185
Sq Ft
$276/Sq Ft
Est. Value
About This Home
This home is located at 5422 W Elgin St, Chandler, AZ 85226 and is currently estimated at $603,629, approximately $276 per square foot. 5422 W Elgin St is a home located in Maricopa County with nearby schools including Kyrene de la Paloma School, Kyrene del Pueblo Middle School, and Mountain Pointe High School.
Ownership History
Date
Name
Owned For
Owner Type
Purchase Details
Closed on
May 22, 2017
Sold by
Frumker Alex and Frumker Allison J
Bought by
Frumker Alex
Current Estimated Value
Purchase Details
Closed on
May 9, 2008
Sold by
Frumker Alex
Bought by
Frumker Alex and Frumker Allison J
Purchase Details
Closed on
Jun 22, 2004
Sold by
Johnson Mark H and Martinez Johnson Ann C
Bought by
Frumker Alex
Home Financials for this Owner
Home Financials are based on the most recent Mortgage that was taken out on this home.
Original Mortgage
$198,400
Outstanding Balance
$93,456
Interest Rate
5.46%
Mortgage Type
Purchase Money Mortgage
Estimated Equity
$510,173
Purchase Details
Closed on
Aug 11, 1995
Sold by
Ryland Homes Of Arizona Inc
Bought by
Johnson Mark H and Martinez Johnson Ann C
Home Financials for this Owner
Home Financials are based on the most recent Mortgage that was taken out on this home.
Original Mortgage
$164,150
Interest Rate
7.63%
Mortgage Type
New Conventional
Create a Home Valuation Report for This Property
The Home Valuation Report is an in-depth analysis detailing your home's value as well as a comparison with similar homes in the area
Home Values in the Area
Average Home Value in this Area
Purchase History
| Date | Buyer | Sale Price | Title Company |
|---|---|---|---|
| Frumker Alex | -- | None Available | |
| Frumker Alex | -- | None Available | |
| Frumker Alex | $248,000 | Nations Title Agency | |
| Johnson Mark H | $172,830 | United Title Agency | |
| Ryland Homes Of Arizona Inc | $118,845 | United Title Agency |
Source: Public Records
Mortgage History
| Date | Status | Borrower | Loan Amount |
|---|---|---|---|
| Open | Frumker Alex | $198,400 | |
| Previous Owner | Johnson Mark H | $164,150 |
Source: Public Records
Tax History Compared to Growth
Tax History
| Year | Tax Paid | Tax Assessment Tax Assessment Total Assessment is a certain percentage of the fair market value that is determined by local assessors to be the total taxable value of land and additions on the property. | Land | Improvement |
|---|---|---|---|---|
| 2025 | $2,480 | $31,137 | -- | -- |
| 2024 | $2,372 | $29,654 | -- | -- |
| 2023 | $2,372 | $43,670 | $8,730 | $34,940 |
| 2022 | $2,258 | $33,480 | $6,690 | $26,790 |
| 2021 | $2,381 | $31,900 | $6,380 | $25,520 |
| 2020 | $2,327 | $30,030 | $6,000 | $24,030 |
| 2019 | $2,259 | $29,780 | $5,950 | $23,830 |
| 2018 | $2,184 | $28,570 | $5,710 | $22,860 |
| 2017 | $2,082 | $27,800 | $5,560 | $22,240 |
| 2016 | $2,125 | $27,020 | $5,400 | $21,620 |
| 2015 | $1,961 | $25,700 | $5,140 | $20,560 |
Source: Public Records
Map
Nearby Homes
- 5361 W Saragosa St
- 5580 W Kesler St
- 840 S Pineview Dr
- 5330 W Kesler Ln
- 5137 W Jupiter Way
- 5043 W Whitten St
- 5143 W Mercury Way
- 5455 W Buffalo St
- 255 S Kyrene Rd Unit 231
- 255 S Kyrene Rd Unit 111
- 5041 W Kesler Ln
- 5882 W Mercury Way
- 5151 W Glenview Place
- 4790 W Geronimo St
- 4624 W Chicago St
- 300 N Gila Springs Blvd Unit 181
- 4613 W Chicago St Unit 2
- 4612 W Jupiter Way
- 4650 W Geronimo St
- 4628 W Buffalo St
- 5412 W Elgin St
- 5432 W Elgin St
- 5421 W Folley St
- 5442 W Elgin St
- 5402 W Elgin St
- 5411 W Folley St
- 5431 W Folley St
- 5423 W Elgin St
- 5441 W Folley St
- 5401 W Folley St
- 5433 W Elgin St
- 5413 W Elgin St
- 5452 W Elgin St
- 5443 W Elgin St
- 5403 W Elgin St
- 5453 W Elgin St
- 5462 W Elgin St
- 5392 W Elgin St
- 5461 W Folley St
- 5420 W Folley St