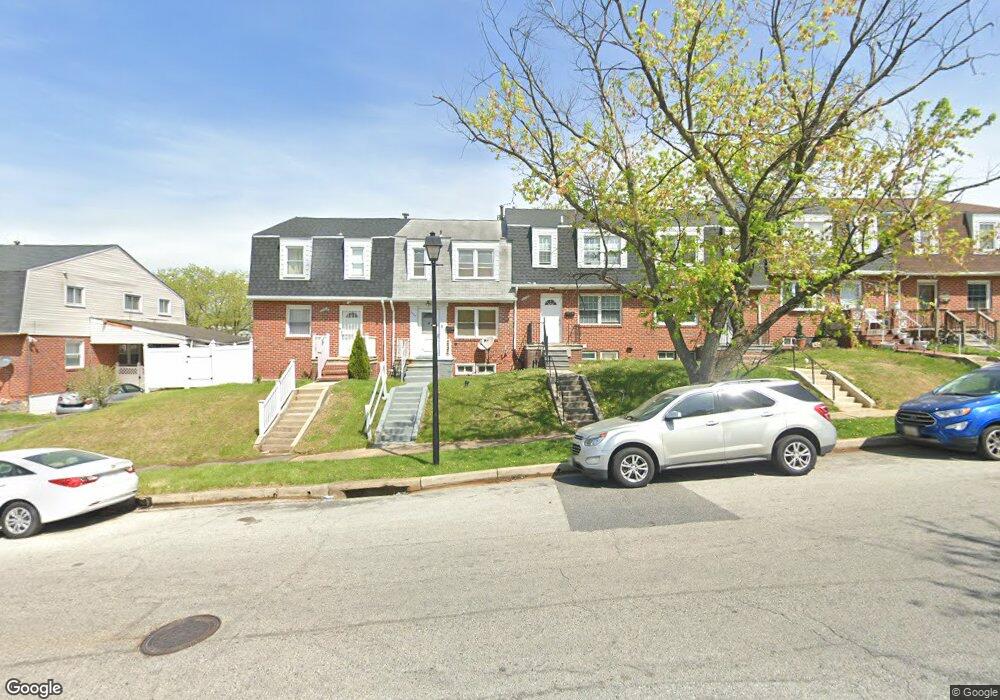
5424 Cynthia Terrace Baltimore, MD 21206
Estimated Value: $188,000 - $244,000
--
Bed
1
Bath
1,184
Sq Ft
$180/Sq Ft
Est. Value
About This Home
This home is located at 5424 Cynthia Terrace, Baltimore, MD 21206 and is currently estimated at $213,375, approximately $180 per square foot. 5424 Cynthia Terrace is a home located in Baltimore County with nearby schools including McCormick Elementary School, Golden Ring Middle School, and Overlea High School.
Ownership History
Date
Name
Owned For
Owner Type
Purchase Details
Closed on
Jun 23, 2006
Sold by
Bonaparte Shantel
Bought by
Robinson Llewellyn
Current Estimated Value
Home Financials for this Owner
Home Financials are based on the most recent Mortgage that was taken out on this home.
Original Mortgage
$171,643
Outstanding Balance
$100,969
Interest Rate
6.58%
Mortgage Type
Purchase Money Mortgage
Estimated Equity
$112,406
Purchase Details
Closed on
May 7, 2001
Sold by
Secretary Of Housing
Bought by
Bonaparte Shantel
Purchase Details
Closed on
Mar 10, 2000
Sold by
Koppenhaver Robert L
Bought by
Secretary Of Housing
Purchase Details
Closed on
Mar 3, 1994
Sold by
Weber Joseph W
Bought by
Koppenhaver Robert L
Home Financials for this Owner
Home Financials are based on the most recent Mortgage that was taken out on this home.
Original Mortgage
$75,350
Interest Rate
7.01%
Create a Home Valuation Report for This Property
The Home Valuation Report is an in-depth analysis detailing your home's value as well as a comparison with similar homes in the area
Home Values in the Area
Average Home Value in this Area
Purchase History
| Date | Buyer | Sale Price | Title Company |
|---|---|---|---|
| Robinson Llewellyn | $173,000 | -- | |
| Bonaparte Shantel | $78,000 | -- | |
| Secretary Of Housing | $81,000 | -- | |
| Koppenhaver Robert L | $74,900 | -- |
Source: Public Records
Mortgage History
| Date | Status | Borrower | Loan Amount |
|---|---|---|---|
| Open | Robinson Llewellyn | $171,643 | |
| Closed | Robinson Llewellyn | $10,000 | |
| Previous Owner | Koppenhaver Robert L | $75,350 |
Source: Public Records
Tax History Compared to Growth
Tax History
| Year | Tax Paid | Tax Assessment Tax Assessment Total Assessment is a certain percentage of the fair market value that is determined by local assessors to be the total taxable value of land and additions on the property. | Land | Improvement |
|---|---|---|---|---|
| 2025 | $2,228 | $146,233 | -- | -- |
| 2024 | $2,228 | $136,367 | $0 | $0 |
| 2023 | $1,099 | $126,500 | $50,000 | $76,500 |
| 2022 | $2,213 | $122,700 | $0 | $0 |
| 2021 | $2,061 | $118,900 | $0 | $0 |
| 2020 | $2,061 | $115,100 | $50,000 | $65,100 |
| 2019 | $2,062 | $115,100 | $50,000 | $65,100 |
| 2018 | $1,962 | $115,100 | $50,000 | $65,100 |
| 2017 | $1,868 | $116,600 | $0 | $0 |
| 2016 | $1,527 | $116,600 | $0 | $0 |
| 2015 | $1,527 | $116,600 | $0 | $0 |
| 2014 | $1,527 | $135,700 | $0 | $0 |
Source: Public Records
Map
Nearby Homes
- 1 Boymans Ct
- 5751 Utrecht Rd
- 5679 Utrecht Rd
- 5688 Utrecht Rd
- 5522 Mccormick Ave
- 6140 Radecke Ave
- 5501 Mccormick Ave
- 5511 Daybreak Terrace
- 8157 Bartholomew Ct
- 8155 Bartholomew Ct
- 8153 Bartholomew Ct
- 8151 Bartholomew Ct
- 8130 Bartholomew Ct
- 8128 Bartholomew Ct
- 8126 Bartholomew Ct
- 8124 Bartholomew Ct
- 8145 Bartholomew Ct
- 8120 Bartholomew Ct
- 8143 Bartholomew Ct
- 8141 Bartholomew Ct
- 5426 Cynthia Terrace
- 5422 Cynthia Terrace
- 5428 Cynthia Terrace
- 5430 Cynthia Terrace
- 5420 Cynthia Terrace
- 5432 Cynthia Terrace
- 5418 Cynthia Terrace
- 5416 Cynthia Terrace
- 5434 Cynthia Terrace
- 5414 Cynthia Terrace
- 9 Boymans Ct
- 5412 Cynthia Terrace
- 5436 Cynthia Terrace
- 7 Boymans Ct
- 5438 Cynthia Terrace
- 5410 Cynthia Terrace
- 5429 Cynthia Terrace
- 5421 Cynthia Terrace
- 5431 Cynthia Terrace
- 5419 Cynthia Terrace