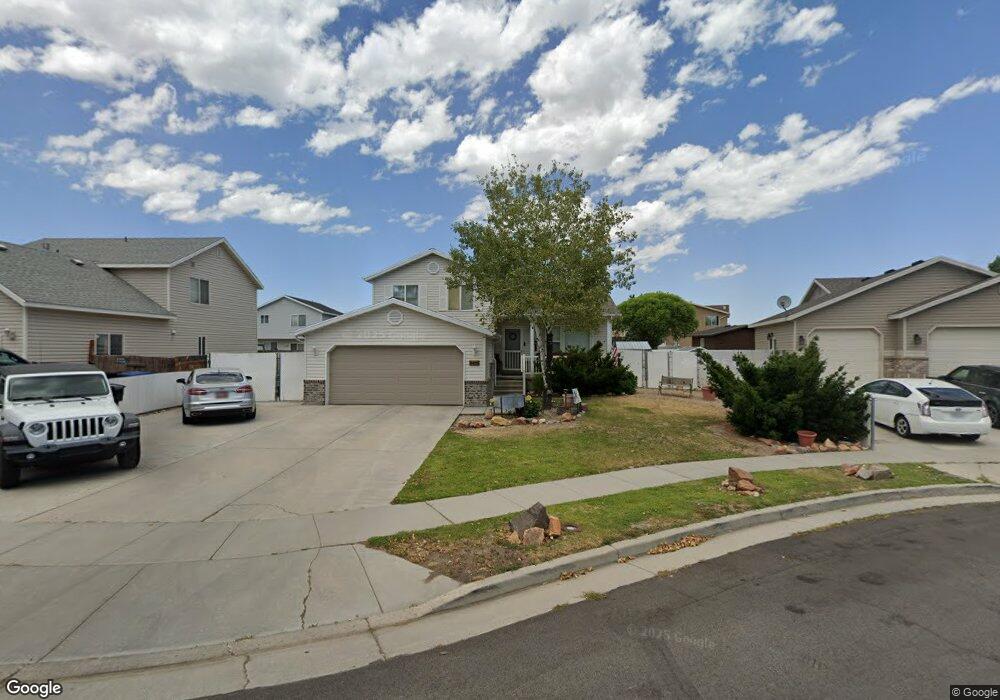
5424 Vista Ridge Way Salt Lake City, UT 84118
Estimated Value: $476,000 - $534,000
3
Beds
2
Baths
1,382
Sq Ft
$361/Sq Ft
Est. Value
About This Home
This home is located at 5424 Vista Ridge Way, Salt Lake City, UT 84118 and is currently estimated at $498,911, approximately $361 per square foot. 5424 Vista Ridge Way is a home located in Salt Lake County with nearby schools including Beehive Elementary, Thomas Jefferson Jr High School, and Kearns High School.
Ownership History
Date
Name
Owned For
Owner Type
Purchase Details
Closed on
Oct 25, 2013
Sold by
Frandsen Randy D
Bought by
Frandsen Randy D and Frandsen Julie A
Current Estimated Value
Home Financials for this Owner
Home Financials are based on the most recent Mortgage that was taken out on this home.
Original Mortgage
$132,466
Outstanding Balance
$99,835
Interest Rate
4.5%
Mortgage Type
FHA
Estimated Equity
$399,076
Purchase Details
Closed on
Feb 23, 2005
Sold by
Frandsen Randy D
Bought by
Frandsen Randy D and Frandsen Julie A
Home Financials for this Owner
Home Financials are based on the most recent Mortgage that was taken out on this home.
Original Mortgage
$153,776
Interest Rate
5.73%
Mortgage Type
FHA
Purchase Details
Closed on
Jan 30, 2004
Sold by
Frandsen Randy D
Bought by
Frandsen Randy D and Frandsen Julie A
Home Financials for this Owner
Home Financials are based on the most recent Mortgage that was taken out on this home.
Original Mortgage
$155,396
Interest Rate
5.79%
Mortgage Type
FHA
Create a Home Valuation Report for This Property
The Home Valuation Report is an in-depth analysis detailing your home's value as well as a comparison with similar homes in the area
Home Values in the Area
Average Home Value in this Area
Purchase History
| Date | Buyer | Sale Price | Title Company |
|---|---|---|---|
| Frandsen Randy D | -- | Benchmark Title Ins Agcy | |
| Frandsen Randy D | -- | Merrill Title | |
| Frandsen Randy D | -- | Merrill Title | |
| Frandsen Randy D | -- | -- | |
| Frandsen Randy D | -- | Merrill Title |
Source: Public Records
Mortgage History
| Date | Status | Borrower | Loan Amount |
|---|---|---|---|
| Open | Frandsen Randy D | $132,466 | |
| Closed | Frandsen Randy D | $153,776 | |
| Closed | Frandsen Randy D | $155,396 |
Source: Public Records
Tax History Compared to Growth
Tax History
| Year | Tax Paid | Tax Assessment Tax Assessment Total Assessment is a certain percentage of the fair market value that is determined by local assessors to be the total taxable value of land and additions on the property. | Land | Improvement |
|---|---|---|---|---|
| 2025 | $3,467 | $477,000 | $153,100 | $323,900 |
| 2024 | $3,467 | $465,400 | $149,800 | $315,600 |
| 2023 | $3,467 | $420,500 | $144,100 | $276,400 |
| 2022 | $3,184 | $421,500 | $141,200 | $280,300 |
| 2021 | $2,822 | $338,200 | $108,600 | $229,600 |
| 2020 | $2,685 | $300,500 | $101,500 | $199,000 |
| 2019 | $2,575 | $285,200 | $84,600 | $200,600 |
| 2018 | $2,446 | $262,000 | $79,900 | $182,100 |
| 2017 | $2,084 | $233,600 | $79,900 | $153,700 |
| 2016 | $1,954 | $219,400 | $79,900 | $139,500 |
| 2015 | $1,863 | $194,800 | $75,500 | $119,300 |
| 2014 | $1,826 | $186,700 | $73,200 | $113,500 |
Source: Public Records
Map
Nearby Homes
- 5418 W Stony Vista Dr
- 5441 W 5440 S
- 5386 Silvertip Dr
- 5586 W Highwood Dr
- 5647 S Sarah Jane Dr
- 5884 Impressions Dr
- 5733 W Plumbago Ave
- 5343 W Ridge Brook Way
- 5365 W Alpine Flower Cir
- 5674 W Pelican Ridge Ln
- 5751 W Chantilly Cir
- 5278 S Kemp Dr
- 5680 W Pelican Ridge Ln
- 5281 S Leprechaun Ln
- 5480 W Sun Ridge Ct
- 5927 S 5665 W
- 5818 W Plumbago Ave
- 5242 S Hamlet Cir
- 5716 Trowbridge Way
- 5032 W Highwood Dr
- 5432 Vista Ridge Way
- 5432 W Vista Ridge Way
- 5416 W Vista Ridge Way
- 5416 Vista Ridge Way
- 5439 Stony Ridge Cir
- 5447 Stony Ridge Cir
- 5438 W Vista Ridge Way
- 5438 Vista Ridge Way
- 5626 Vista Ridge Way
- 5611 Vista Ridge Way
- 5435 W Stony Ridge Cir
- 5435 Stony Ridge Cir
- 5455 Stony Ridge Cir
- 5643 Impressions Dr
- 5643 S Impressions Dr
- 5615 S Vista Ridge Way
- 5615 Vista Ridge Way
- 5634 Vista Ridge Way
- 5390 Summit Flower Cir
- 5651 Impressions Dr