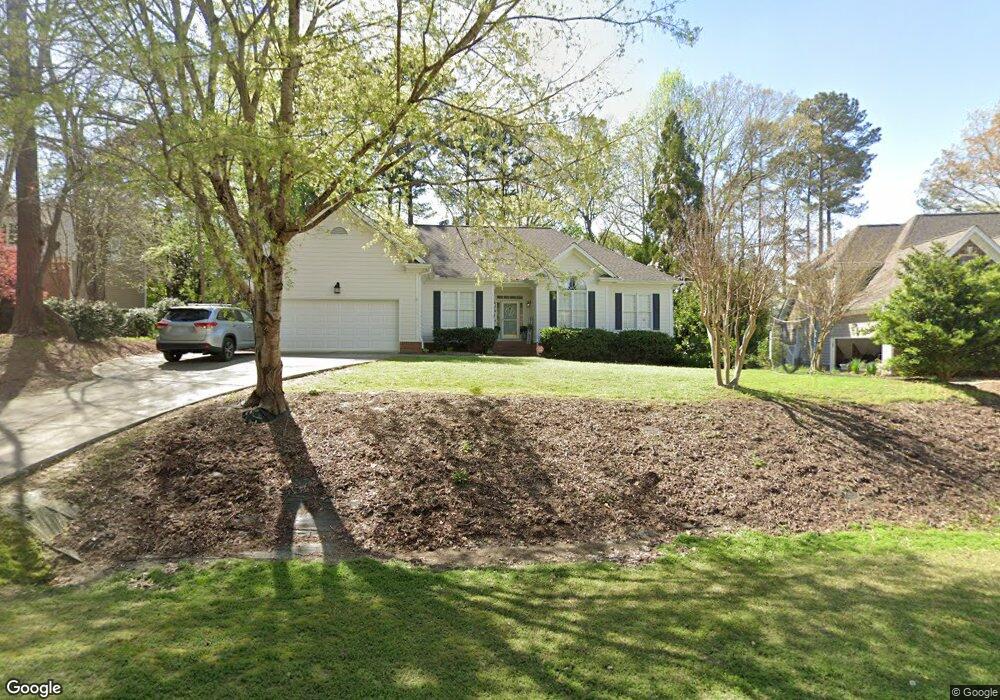
5425 Greensflag Ln Fuquay Varina, NC 27526
Estimated Value: $515,000 - $540,614
4
Beds
3
Baths
2,578
Sq Ft
$204/Sq Ft
Est. Value
About This Home
This home is located at 5425 Greensflag Ln, Fuquay Varina, NC 27526 and is currently estimated at $525,404, approximately $203 per square foot. 5425 Greensflag Ln is a home located in Wake County with nearby schools including Banks Road Elementary School.
Ownership History
Date
Name
Owned For
Owner Type
Purchase Details
Closed on
Jan 23, 2019
Sold by
Crawford Bridget Schmitz
Bought by
Vickers Criig B and Vickers Tifany H
Current Estimated Value
Home Financials for this Owner
Home Financials are based on the most recent Mortgage that was taken out on this home.
Original Mortgage
$236,000
Outstanding Balance
$207,492
Interest Rate
4.6%
Mortgage Type
New Conventional
Estimated Equity
$317,912
Purchase Details
Closed on
Jul 15, 2011
Sold by
Crawford Mark F
Bought by
Crawford Bridget Schmitz
Purchase Details
Closed on
Aug 23, 1999
Sold by
Jkl Custom Homes Inc
Bought by
Crawford Mark F and Crawford Bridget S
Home Financials for this Owner
Home Financials are based on the most recent Mortgage that was taken out on this home.
Original Mortgage
$230,600
Interest Rate
7.5%
Create a Home Valuation Report for This Property
The Home Valuation Report is an in-depth analysis detailing your home's value as well as a comparison with similar homes in the area
Home Values in the Area
Average Home Value in this Area
Purchase History
| Date | Buyer | Sale Price | Title Company |
|---|---|---|---|
| Vickers Criig B | $290,000 | None Available | |
| Crawford Bridget Schmitz | -- | None Available | |
| Crawford Mark F | $288,500 | -- |
Source: Public Records
Mortgage History
| Date | Status | Borrower | Loan Amount |
|---|---|---|---|
| Open | Vickers Criig B | $236,000 | |
| Previous Owner | Crawford Mark F | $230,600 |
Source: Public Records
Tax History Compared to Growth
Tax History
| Year | Tax Paid | Tax Assessment Tax Assessment Total Assessment is a certain percentage of the fair market value that is determined by local assessors to be the total taxable value of land and additions on the property. | Land | Improvement |
|---|---|---|---|---|
| 2025 | $2,924 | $453,991 | $120,000 | $333,991 |
| 2024 | $2,839 | $453,991 | $120,000 | $333,991 |
| 2023 | $2,373 | $301,810 | $75,000 | $226,810 |
| 2022 | $2,200 | $301,810 | $75,000 | $226,810 |
| 2021 | $2,141 | $301,810 | $75,000 | $226,810 |
| 2020 | $2,106 | $301,810 | $75,000 | $226,810 |
| 2019 | $2,647 | $321,692 | $44,000 | $277,692 |
| 2018 | $2,434 | $321,692 | $44,000 | $277,692 |
| 2017 | $2,307 | $321,692 | $44,000 | $277,692 |
| 2016 | $2,261 | $321,692 | $44,000 | $277,692 |
| 2015 | $2,487 | $355,240 | $78,000 | $277,240 |
| 2014 | $2,357 | $355,240 | $78,000 | $277,240 |
Source: Public Records
Map
Nearby Homes
- 5401 Greensflag Ln
- 5417 Willow Bridge Ln
- 4716 Shady Greens Dr
- 4700 Linaria Ln
- 4737 Shady Greens Dr
- 4229 Hilltop Needmore Rd
- 4225 Hilltop Needmore Rd
- 5217 W Oaks Dr
- 3101 Canopy Woods Dr
- 4711 Brighton Ridge Dr
- 9704 Eden Trail
- 2512 Thurrock Dr
- 2724 Glastonbury Rd
- 2417 Ridgeford Ct
- 9645 Eden Trail
- 4812 Morecambe Way
- 4305 Windscape Dr
- 6028 Spicewood Dr
- 2628 Forestbluff Dr
- 6104 Spicewood Dr
- 5421 Greensflag Ln
- 5429 Greensflag Ln
- 5417 Greensflag Ln
- 5433 Greensflag Ln
- 5436 Greensflag Ln
- 5424 Greensflag Ln
- 5413 Greensflag Ln
- 5437 Greensflag Ln
- 4708 Hybrid Ct
- 5440 Greensflag Ln
- 5441 Greensflag Ln
- 5409 Greensflag Ln
- 2805 Green Bark Ct
- 5225 Crooked Bluff Ln
- 5221 Crooked Bluff Ln
- 4704 Hybrid Ct
- 5229 Crooked Bluff Ln
- 2809 Green Bark Ct
- 5445 Greensflag Ln
- 5416 Greensflag Ln